

Dashboard
The dashboards show how your customer service is doing: how many tickets came in and from where, how quickly your team answered and resolved them, how many met their deadlines and what each person did. Team leads use them to plan staffing and spot problems; agents use them to see their own numbers. Every figure is calculated from your tickets when you open a dashboard, for a period you choose, and most figures compare that period with the one before it.
Dashboard in the sidebar holds eight screens. Seven show widgets you can arrange for yourself, and one, Reports, downloads CSV files. Which dashboards you see is set for each user by an admin, so a user may have Overview without Users. The rules they all share, such as how periods, working hours and the comparison percentages work, are explained in How the dashboards count.
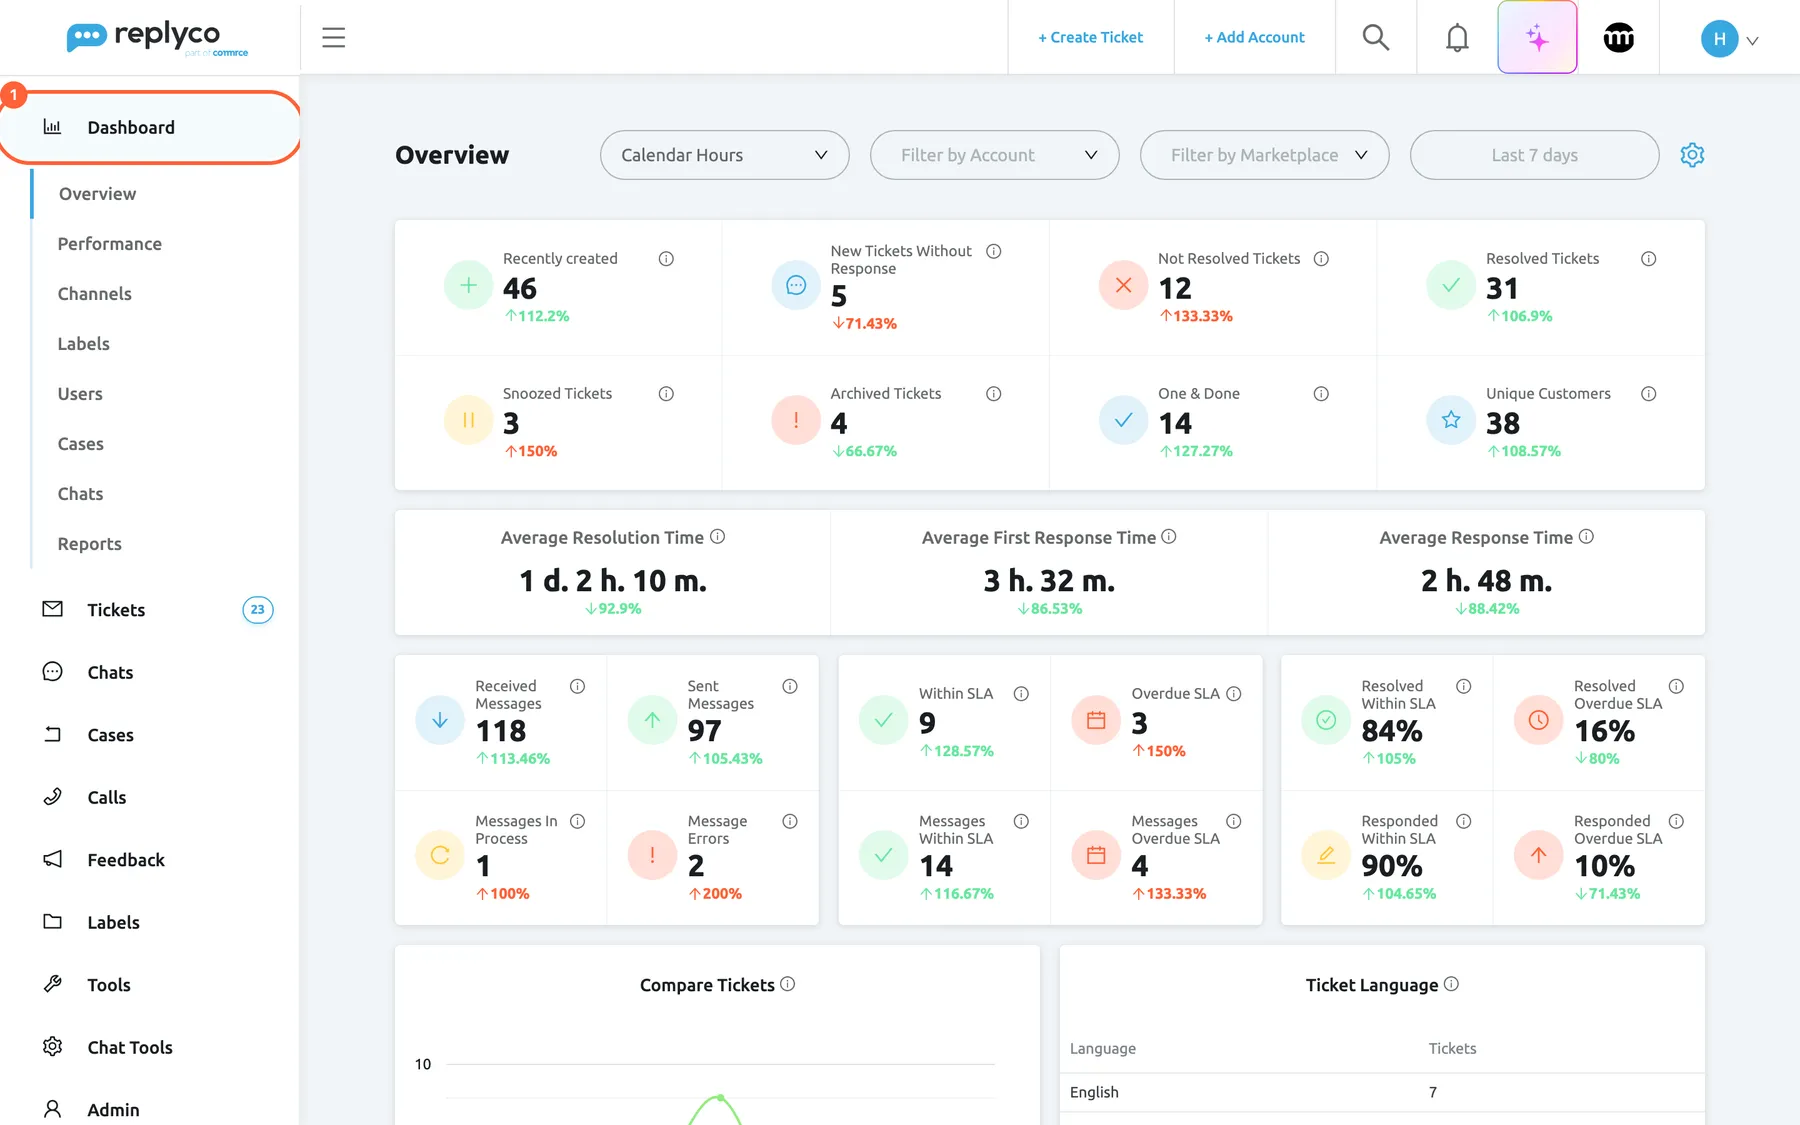
What this screenshot shows
- Screen
- Overview (/dashboard/overview)
- Highlighted
- menuitem “Dashboard”, sidebar-left, expanded. lists the eight dashboards
- Also visible
- Dashboard menu with Overview, Performance, Channels, Labels, Users, Cases, Chats, Reports; header: hours option, Filter by Account, Filter by Marketplace, Last 7 days, gear icon; ticket cards with comparison percentages; average times
- Purpose
- where the dashboards live
The screens in this area
Section titled “The screens in this area”| Screen | What it is for |
|---|---|
| Overview dashboard | The period at a glance: tickets created and what became of them, messages, deadlines met and missed, average first response, response and resolution times, languages, buyer locations and the customers’ tone per product |
| Performance dashboard | How many messages each person sent per day, when new tickets arrive by hour and weekday, and how often each template and auto-response rule was used |
| Channels dashboard | Tickets per connected account and per marketplace, by status |
| Labels dashboard | Tickets per label, by status |
| Users dashboard | Each person’s tickets, messages, deadlines, average times and actions, for one person or everyone |
| Cases dashboard | eBay return cases: how many are not resolved yet, how many buyers opened in the period, how long closing them took, and the eBay status of the new ones |
| Chats dashboard | Chats started in the period, open and closed, per account and channel, when they arrive, each person’s chats and messages, and the time to reply and to close |
| Reports | CSV downloads of ticket, order and custom-field values, and of every action your team took on tickets |
What you can do here
Section titled “What you can do here”- Check the week’s workload and speed on one screen, compared with the week before. Overview dashboard
- Compare your team, person by person, from tickets resolved to average first response time. Users dashboard
- Find where the tickets come from, by account, marketplace or label, to see which channel or topic needs attention. Channels dashboard · Labels dashboard
- Count only working hours, so nights and weekends do not stretch your response times. How the dashboards count
- Take data into a spreadsheet, from the ticket list or as a report for a whole period. Export tickets and reports
- Decide who sees which dashboard, per user on the Access Rights tab. User permissions and roles
Concepts
Section titled “Concepts”- How the dashboards count explains what every dashboard shares: periods and time zones, which tickets count, the three average times, working hours, the comparison with the previous period, filters, refresh and access.
Availability: the Overview dashboard is part of every plan. Performance, Channels, Labels, Users, Cases and Reports need Advanced Reporting, and Chats a chat channel; every plan includes both. The Cases dashboard also needs the Cases permission. Each dashboard appears only for users who have it ticked in their dashboard access. See What each plan includes.