

How the dashboards count
Every dashboard under Dashboard counts by the same rules, and most surprises come from them rather than from a single widget: which days a period covers, which tickets are left out, what a response time measures, what Working Hours changes, what the percentage under a number means and who sees which dashboard. Replyco calculates every figure from your tickets at the moment the dashboard asks for it, for the whole company, and keeps nothing between visits except the layout of your widgets. This page explains those shared rules; each dashboard’s own widgets are explained on its page.
How it works
Section titled “How it works”Periods and time zones
Section titled “Periods and time zones”Every dashboard has a period button in its header. Each dashboard opens with Last 7 days, and the period you choose is not kept when you open another dashboard or reload the page.
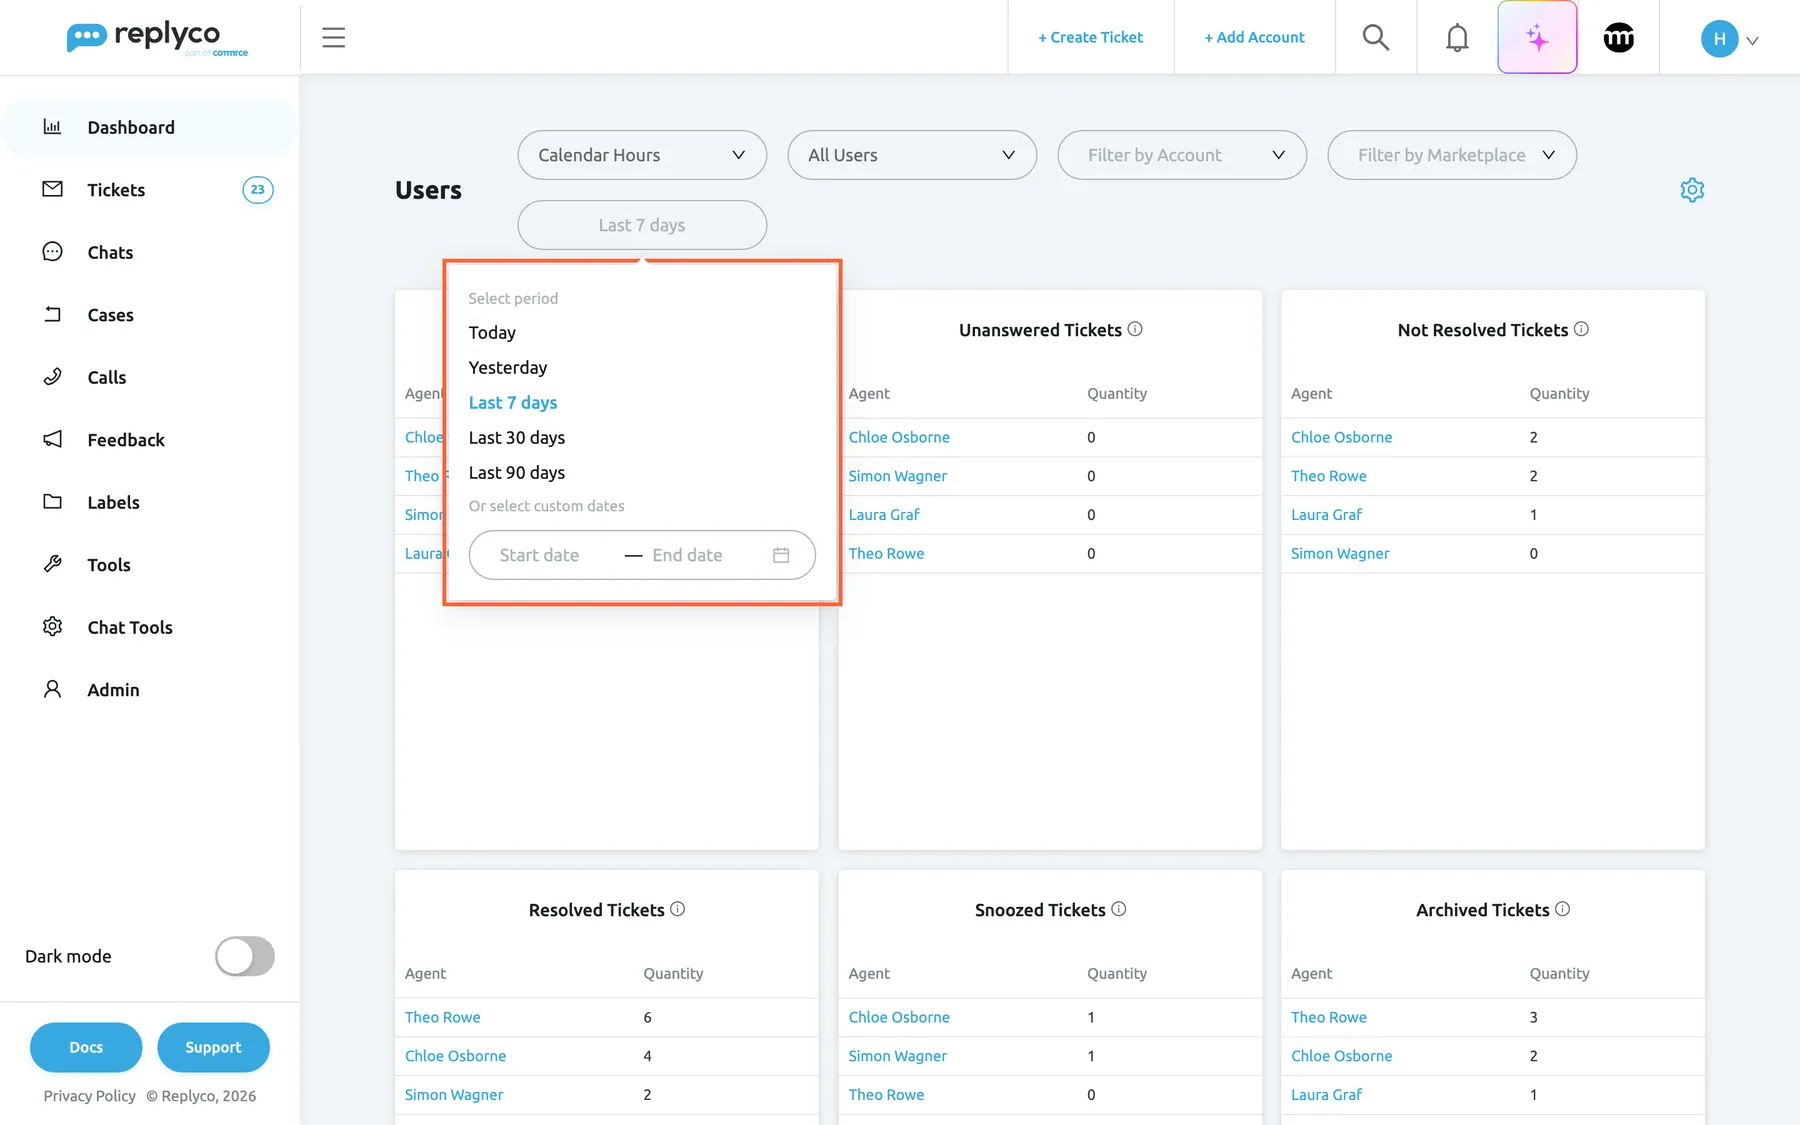
What this screenshot shows
- Screen
- Users (/dashboard/users)
- Highlighted
- dialog “Select period”, header, open. sets the period of every widget on the dashboard
- Also visible
- periods Today, Yesterday, Last 7 days, Last 30 days, Last 90 days; custom start and end date; hours option Calendar Hours; All Users; Filter by Account
- Purpose
- how a dashboard's period is chosen
| Period | Days it covers, seen on Tuesday 10 March |
|---|---|
| Today | 10 March |
| Yesterday | 9 March |
| Last 7 days | 3 to 10 March: today and the 7 days before, 8 days in all |
| Last 30 days | 8 February to 10 March, 31 days |
| Last 90 days | 10 December to 10 March, 91 days |
| Dates under Or select custom dates | From the first to the last day you pick |
A period always runs from the start of its first day to the end of its last day, in your own local days. Replyco stores all data in UTC and converts the dates you choose into UTC for the search, so a day on a dashboard starts and ends at your midnight. The two charts that show hours of the day, Ticket Count on the Performance dashboard and the message chart on the Users dashboard, move their hours to your computer’s time zone.
Which tickets and messages count
Section titled “Which tickets and messages count”Each figure is anchored to one date, and the period selects by that date:
| Kind of figure | Selected by | Examples |
|---|---|---|
| Tickets | The date the ticket was created | Created, resolved, open, snoozed and archived tickets; tickets per channel, account or label |
| Messages | The date the message was sent or received | Received and sent messages, messages per user |
| Actions | The date someone took the action | Tickets a user resolved, archived or snoozed; actions per day |
| Resolution time | The ticket’s creation date on the Overview dashboard; the date of resolving on the Users dashboard | Average resolution time |
A ticket figure describes the ticket’s state now. A ticket created last week and resolved this morning counts as resolved in last week’s figures, so a week’s numbers change after the week is over.
Some tickets are left out:
| Tickets | Where they are left out |
|---|---|
| Replyco’s own welcome ticket for a new company | Every dashboard |
| Tickets of customers you have blocked | Overview, Performance (ticket counts and messages per user), Channels and Labels; the Users dashboard and the template and auto-response counts include them |
The Chats dashboard counts chats, not tickets, and the Cases dashboard counts eBay cases.
First response, response and resolution times
Section titled “First response, response and resolution times”Three averages appear on the Overview dashboard and, per person, on the Users dashboard. Auto-responses never count as a reply, and a message nobody has answered yet is not in the averages.
| Time | Overview dashboard | Users dashboard |
|---|---|---|
| First response | From the ticket’s creation to your team’s first reply after the customer’s first message, for tickets whose first message came from the customer | The same measure, credited to the person who sent the ticket’s first reply, selected by the date of that reply |
| Response | From a message received to your team’s next reply in the same ticket | From each customer message to the next reply, credited to the person who replied |
| Resolution | From the ticket’s creation to the first time it was resolved, for tickets created in the period | The same measure, credited to the person who first resolved the ticket, selected by the date of resolving |
A ticket resolved, reopened and resolved again counts with its first resolution. Times show days, hours and minutes, such as 1 d. 2 h. 10 m., rounded down to the minute; a dash means there was nothing to average.
Working hours and calendar hours
Section titled “Working hours and calendar hours”The Overview, Users, Cases and Chats dashboards have an hours option as the first control of their header. It reads Calendar Hours or Working Hours. It changes only the average times; counts of tickets and messages stay the same.
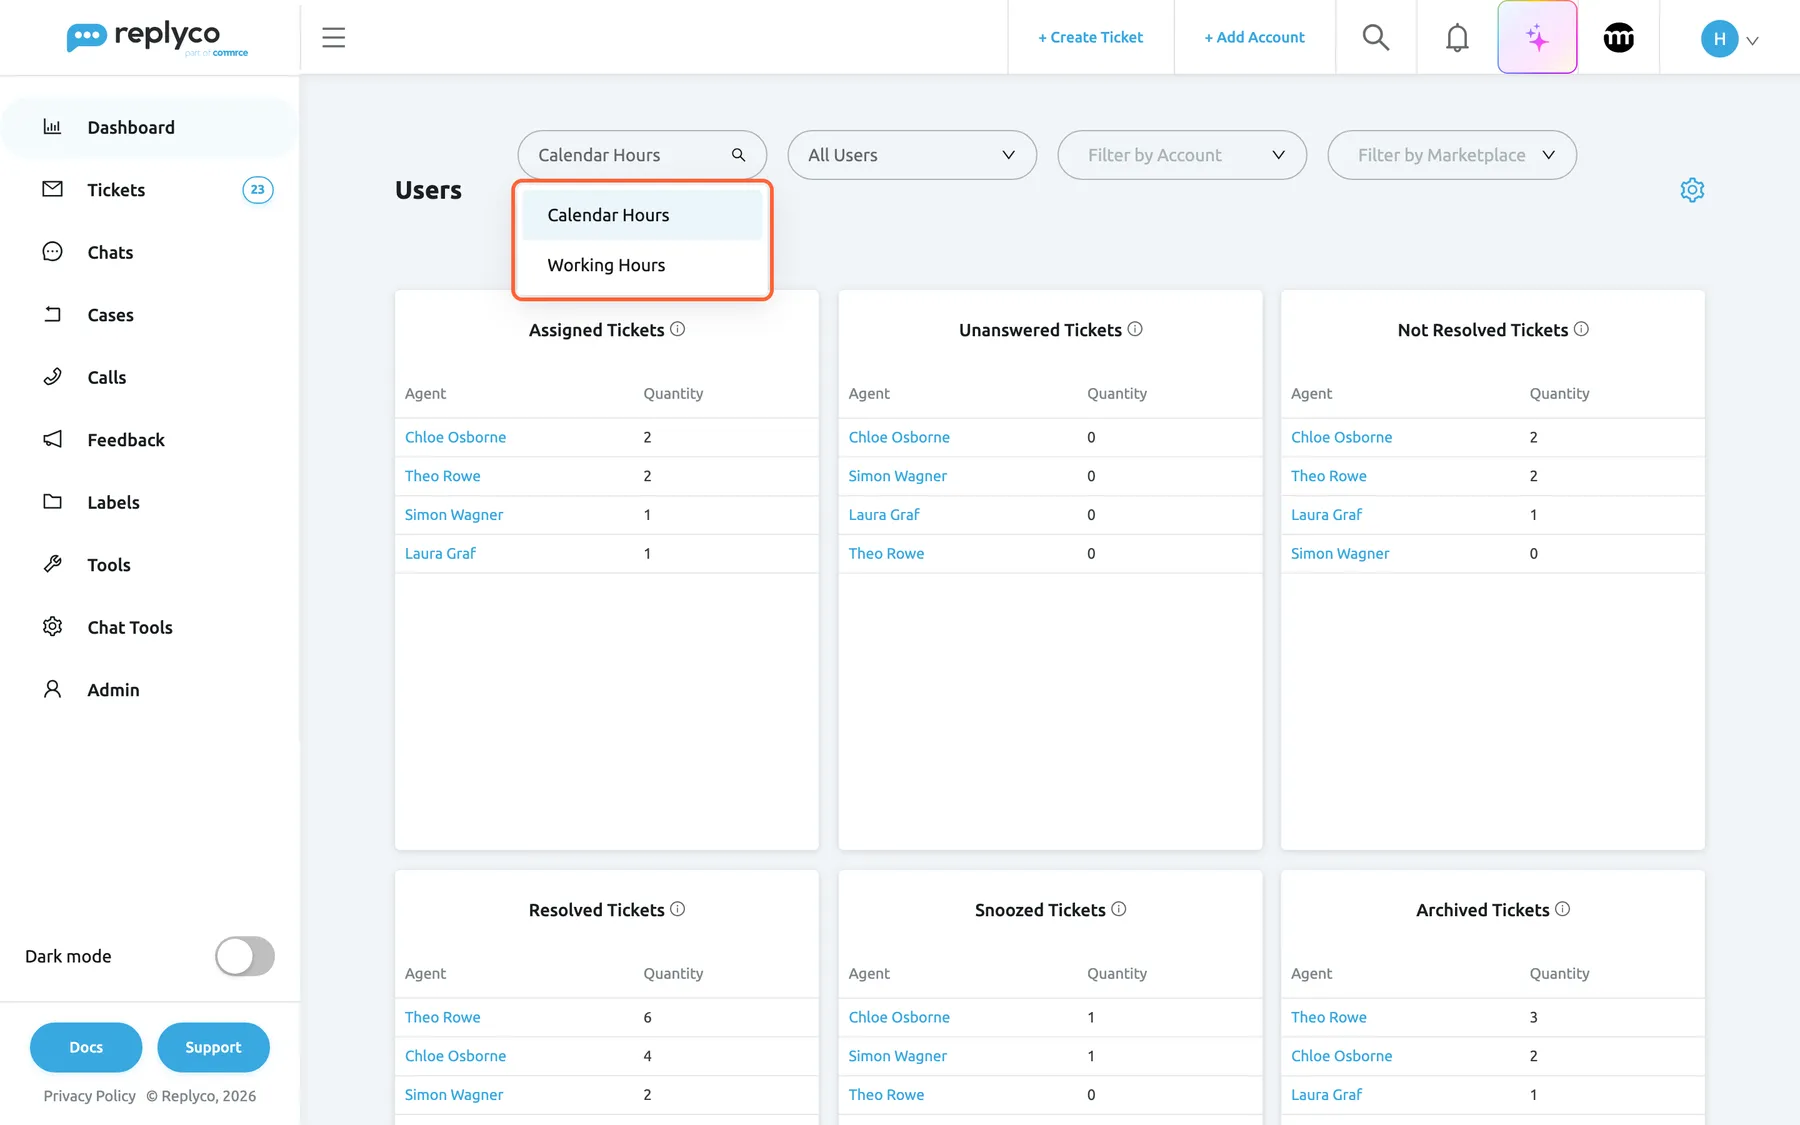
What this screenshot shows
- Screen
- Users (/dashboard/users)
- Highlighted
- option “Working Hours”, header-left, shown. counts average times in working hours only
- Also visible
- options Calendar Hours (selected) and Working Hours; All Users; Filter by Account; period Last 7 days; per-user ticket tables
- Purpose
- calendar hours versus working hours
- Calendar Hours counts every minute between the two moments, nights and weekends included.
- Working Hours counts only the minutes between your company’s daily start and end time. A message that arrives before the working day counts from its start; a reply after the end counts up to the end.
The start and end time come from Working Time in AdminCompany Settings; see Set your working days, hours and holidays.
Each dashboard opens with Calendar Hours unless Use Working Hours in Dashboards is switched on in your Account Settings, on the Settings tab; see Account Settings. A choice made on a dashboard lasts until you leave it. Response deadlines (SLA) follow each priority’s own choice of calendar or working hours, not this option; see Ticket priorities and SLA.
The comparison with the previous period
Section titled “The comparison with the previous period”Under many numbers a percentage compares the period with the one directly before it, of the same length: Last 7 days seen on 10 March, 3 to 10 March, is compared with 24 February to 2 March. The percentage is the current value as a share of the previous one, not the change:
| Previous period | This period | Shown |
|---|---|---|
| 40 | 46 | 115% with an arrow up |
| 40 | 40 | 100% with an arrow up |
| 40 | 20 | 50% with an arrow down |
| 40 | 0 | 0%, grey, no arrow |
| 0 | 12 | 100% with an arrow up |
Green means better and red means worse, so for figures where less is better, such as open tickets, overdue tickets and the average times, an arrow up is red. When every previous value in a widget is 0, the widget shows no percentages.
Filters: accounts, marketplaces, users and labels
Section titled “Filters: accounts, marketplaces, users and labels”The filters in a dashboard’s header narrow every widget on it:
| Dashboard | Period | Hours option | Users | Filter by Account | Filter by Marketplace |
|---|---|---|---|---|---|
| Overview | Yes | Yes | – | Yes | Yes |
| Performance | Yes | – | – | Yes | Yes |
| Channels | Yes | – | – | – | – |
| Labels | Yes | – | – | Yes | Yes |
| Users | Yes | Yes | One person or All Users | Yes | Yes |
| Cases | Yes | Yes | – | Yes | – |
| Chats | Yes | Yes | – | – | – |
| Reports | Its own date range | – | Its own user list | – | – |
- Accounts narrow ticket figures to the tickets of the chosen connected accounts, and message figures to the messages sent or received through them. Pick several accounts to add them up.
- Marketplaces narrow to channels, such as all your Amazon accounts together.
- Users exist only on the Users dashboard, where one person or everyone is shown.
- Labels have no filter. The Labels dashboard breaks tickets down by label instead: a ticket with two labels counts under each, and tickets without one count under No Label.
No filter is remembered. Each dashboard opens with every account and marketplace, All Users, the last 7 days and your hours setting.
When the figures update
Section titled “When the figures update”A dashboard fetches its figures when you open it and again whenever you change the period, a filter or the hours option. It does not refresh by itself while it stays open: a ticket that arrives meanwhile appears once you change a filter or open the dashboard again. Figures are not stored or cached between visits, so the same period can show different numbers tomorrow, because ticket states have changed.
Who sees which dashboard
Section titled “Who sees which dashboard”- Access per user. An admin ticks the dashboards each user sees in the Dashboard section of the user’s Access Rights in AdminUsers. A dashboard that is not ticked disappears from the user’s menu; with none ticked, Dashboard disappears. Inviting a new user with a role preselects dashboards; with the User role, only the Overview. See User permissions and roles.
- Locks. A dashboard with a lock asks Your subscription plan doesn't include this feature. Do you want to go on the billing page to unlock this feature? and leads to AdminBilling. Performance, Channels, Labels, Users and Reports need Advanced Reporting and Chats a chat channel; every current plan includes both, and companies on an older plan may not have them, see What each plan includes. Cases needs the Cases feature and, for your user, the Cases permission. See eBay cases.
Layout and currency
Section titled “Layout and currency”Each person arranges their own dashboards: the gear icon at the right of the header offers Turn ON Edit Mode to move and resize widgets and Manage Widgets to add or remove them. The layout is saved to your user, so it follows you to any computer, and it changes nobody else’s view. Removing every widget brings back the standard layout. The currency for money figures is set with Dashboards currency in the company settings; see Company Settings.
Example
Section titled “Example”Northwind Electronics sets its working time to 09:00–17:00 in AdminCompany Settings. On Friday 6 March at 16:00 Oliver Bennett writes that his earbuds arrived with a cracked charging case. Chloe Osborne replies on Monday 9 March at 10:00. An auto-response went out at 16:01; it does not count.
| Figure | Calendar Hours | Working Hours |
|---|---|---|
| First response for this ticket | Friday 16:00 to Monday 10:00: 2 d. 18 h. 0 m. | Friday 16:00–17:00 plus Monday 09:00–10:00: 2 h. 0 m. |
| Counted on the Overview dashboard | In Last 7 days seen on 10 March, because the customer’s first message arrived on 6 March | The same ticket, the same period |
| Counted on the Users dashboard | Credited to Chloe Osborne, in periods that include 9 March, the day of her reply | The same |
On 10 March the Overview dashboard shows 46 tickets created from 3 to 10 March, against 41 from 24 February to 2 March: the card reads 112.2% with a green arrow up. With Working Hours selected, Average First Response Time drops, because the time outside the working day no longer counts.
What it does not do
Section titled “What it does not do”- It does not remember your choices. Period, filters and the hours option reset when you open another dashboard or reload; only the widget layout is saved.
- It does not refresh by itself. Figures stay as loaded until you change a filter or open the dashboard again.
- It does not freeze past figures. A period’s numbers follow the tickets’ current state, so they change when tickets are resolved, archived or deleted later.
- It does not export. To take ticket data out, use the ticket list or the Reports screen; see Export tickets and reports.
Where you see it
Section titled “Where you see it”- Overview dashboard: ticket, message, SLA and average-time cards with comparisons, and the hours option
- Performance dashboard: tickets and replies over time, with hours in your time zone
- Channels dashboard and Labels dashboard: tickets per account, channel and label
- Users dashboard: the same measures per person, with the users filter and the hours option
- Cases dashboard and Chats dashboard: cases and chats, with the hours option
- Reports: its own date range and user list
- Account Settings: Use Working Hours in Dashboards
- Users: which dashboards each person sees