

Overview dashboard
The Overview dashboard is where a team lead or owner sees how support went: how many tickets came in, how many are still open, how fast your team answered, which deadlines were kept and where the customers are. Open it from DashboardOverview in the sidebar. Every number covers the period you choose, the last 7 days when you open the screen, and is compared with the same number of days just before it. The numbers are counted for your whole company, across every account unless you narrow them with the filters.
What you can do here
Section titled “What you can do here”- See the period’s tickets at a glance. Eight cards count the tickets created in the period and what became of them: open, resolved, snoozed, archived, answered once and closed, and how many different customers wrote. Read the ticket numbers
- Tell whether a number went up or down. Under each number a percentage compares it with the previous period; it is the current value as a share of the previous one, not the change. Read the comparison with the previous period
- Choose the period. Pick today, yesterday, the last 7, 30 or 90 days, or your own dates. Choose the period
- Look at one shop or channel. Narrow every widget to some accounts or marketplaces. Filter by account and marketplace
- See how fast your team answers and resolves. Three average times measure resolution, first response and every response, without auto-responses. Measure response and resolution times
- Count only working hours. Switch the average times to your company’s working hours, so a night does not count against the team. Count only working hours · Working time
- Check the deadlines of your priorities. Two widgets count the tickets and messages within and past their respond-by, and the share answered and resolved in time. Check your deadlines · Ticket priorities and SLA
- Spot messages that did not go out. Received, sent, still processing and failed messages for the period. Check messages in, out and stuck
- Open the tickets behind a number. Most ticket cards open the ticket list with the same period and filters. Open the tickets behind a number
- Follow the daily flow. A chart puts created, answered and resolved tickets side by side for each day. Compare tickets day by day
- See which languages wait and where buyers are. A table of waiting tickets by language and a map of orders by country. See ticket languages and buyer countries
- Find the products behind unhappy customers. With tone analysis on, a widget ranks products by the average tone of their tickets, worst first. Find products with unhappy customers · Message tone analysis
- Arrange the dashboard for yourself. Hide, move, resize and remove widgets; the layout is saved for your user only. Arrange your dashboard
The screen at a glance
Section titled “The screen at a glance”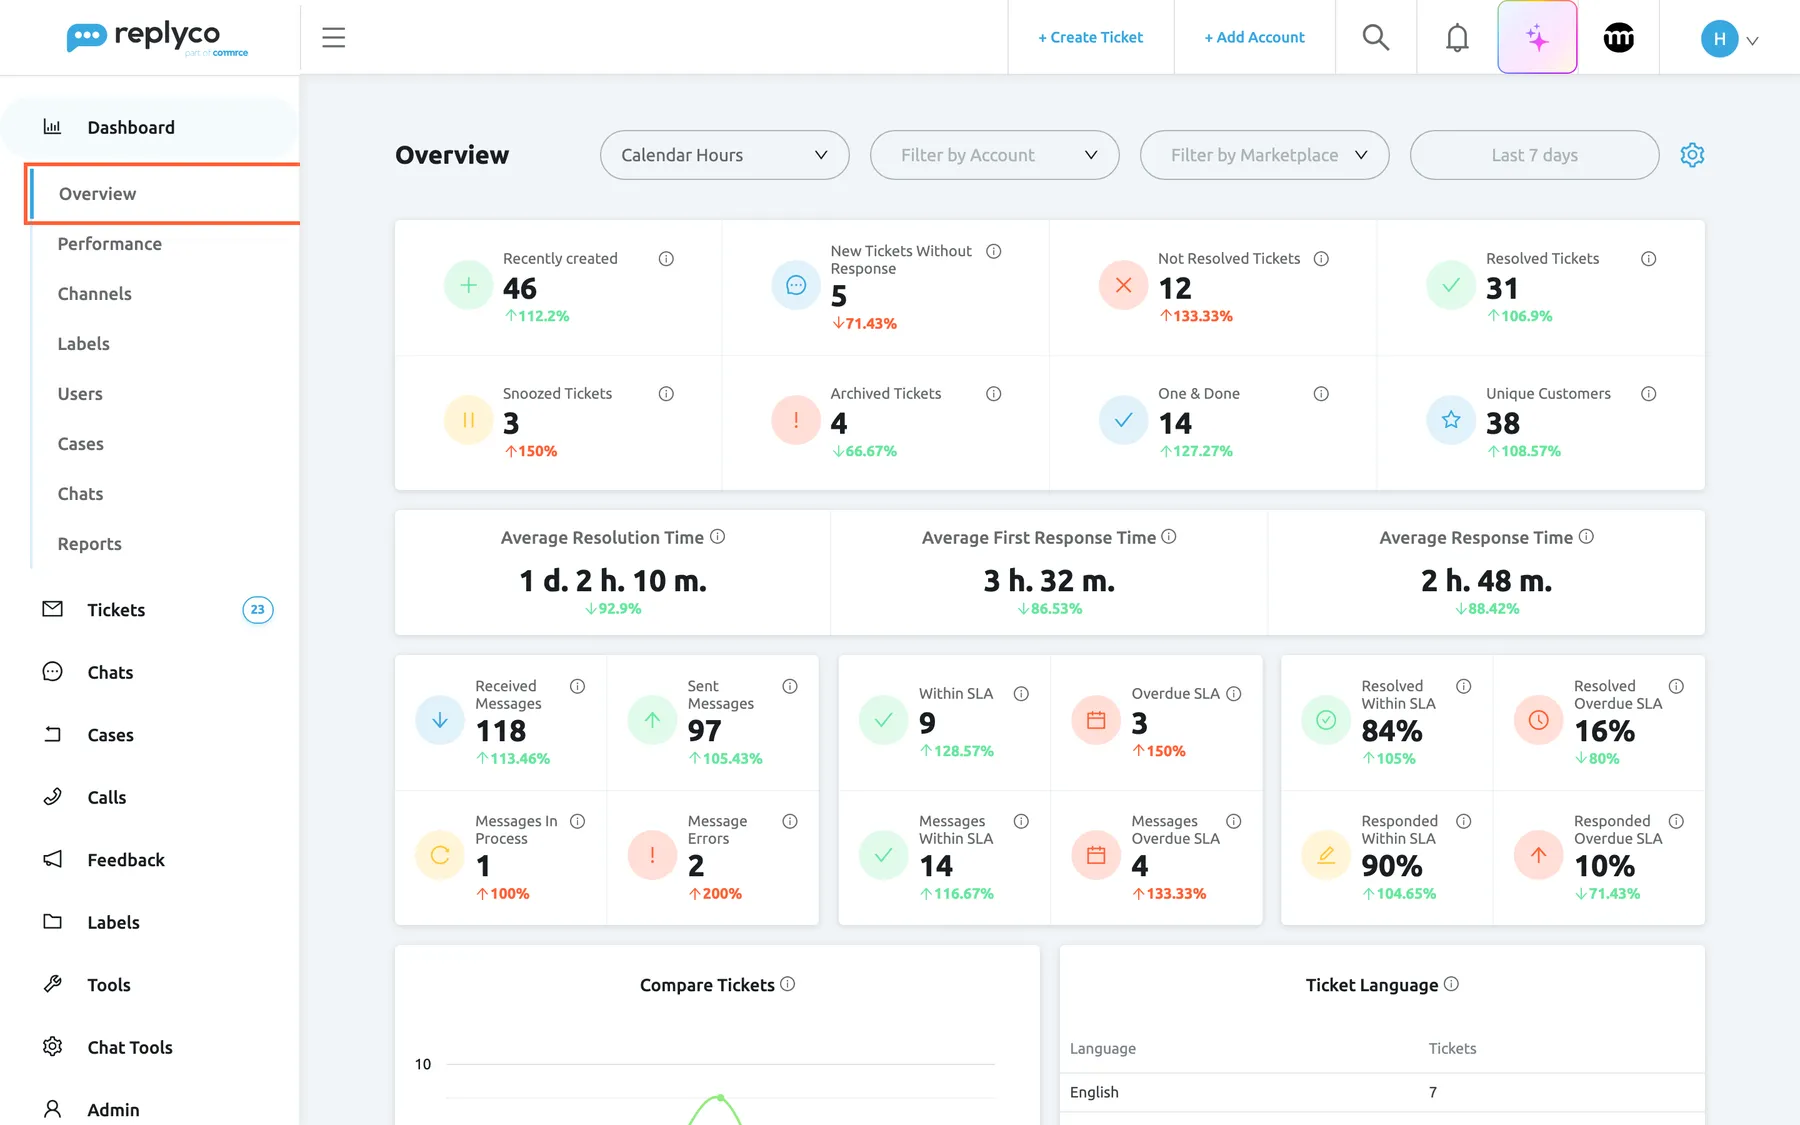
What this screenshot shows
- Screen
- Overview (/dashboard/overview)
- Highlighted
- menuitem “Overview”, sidebar-left, selected. opens the Overview dashboard
- Also visible
- Dashboard menu expanded with eight dashboards; header: working-hours selector, account filter, marketplace filter, period Last 7 days, gear icon; tickets widget with eight cards and comparison percentages; average times widget; messages and SLA widgets
- Purpose
- the Overview dashboard as it opens
| Region | What it shows | What you do there |
|---|---|---|
| Overview in the sidebar, under Dashboard | The first of the dashboards your user may open | Open the dashboard |
| Header, left | The title Overview | – |
| Header, right | The Calendar Hours select, Filter by Account, Filter by Marketplace, the period button and a gear icon | Choose how times are measured, which accounts and marketplaces count, the period; arrange widgets |
| Tickets calculation | Eight ticket cards, from Recently created to Unique Customers | Read the counts; open the tickets behind most of them |
| Average time | Average Resolution Time, Average First Response Time, Average Response Time | Read how fast the team works |
| Information about messages | Received, sent, processing and failed messages | Spot messages that did not go out |
| Due/Overdue tickets and Due/Overdue responded/resolved tickets | Tickets and messages within or past their deadlines, and the share handled in time | Check your service level |
| Compare Tickets | Created, resolved and responded tickets per day | See whether the team keeps up |
| Ticket Language | Waiting tickets per language | Plan language skills and translation |
| Buyer locations | Orders per country, on a map and in a table | See where customers are |
| Average tone by product | Products ranked by the tone of their tickets | Find unhappy products |
The widgets are shown in this order when you first use the dashboard; you can move, resize or hide each of them. While a widget loads it shows grey placeholder bars. A widget with nothing to count shows a frown and No data....
Read the ticket numbers
Section titled “Read the ticket numbers”The Tickets calculation widget at the top counts tickets created in the period and shows what state they are in now. A ticket created last week and resolved today counts as resolved when you look at last week.
| Card | What it counts | Selecting it opens |
|---|---|---|
| Recently created | Every ticket created in the period | All Tickets with the period and filters |
| New Tickets Without Response | Tickets with at least one unread message and nothing sent from your side yet, not even an auto-response | All Tickets, only new tickets |
| Not Resolved Tickets | Tickets that are open and not archived | All Tickets, only open tickets |
| Resolved Tickets | Tickets that are resolved now | All Tickets, only resolved tickets |
| Snoozed Tickets | Tickets snoozed right now | Snoozed |
| Archived Tickets | Tickets that are archived now | Archive |
| One & Done | Resolved tickets with exactly two messages, the customer’s and your one reply | All Tickets |
| Unique Customers | Different customers among the tickets created in the period | Nothing; the card is not a link |
Example. In the week from 3 to 10 March, Northwind Electronics received 46 new tickets from 38 customers. 31 are resolved, 12 are still open, 3 are snoozed and 4 archived; 14 were closed after a single reply. The open tickets include the 5 that nobody has answered or opened yet, so New Tickets Without Response is where to start.
Tickets of blocked customers and the welcome ticket Replyco creates for a new company are not counted in the ticket, message, time and deadline widgets. To see blocked tickets, open Blocked tickets.
Read the comparison with the previous period
Section titled “Read the comparison with the previous period”Under most numbers Replyco shows a percentage with an arrow. It compares the period with the same number of days just before it: for the last 7 days, the eight days before them. The percentage is the current value as a share of the previous value, so 112.2% means “112.2% of last time”, about 12% more, and 71.43% means about 29% less.
| Current | Previous | Shown | Meaning |
|---|---|---|---|
| 46 | 41 | ↑ 112.2% | 5 more tickets than before |
| 5 | 7 | ↓ 71.43% | 2 fewer |
| 41 | 41 | ↑ 100% | Unchanged |
| 0 | 3 | 0%, grey, no arrow | None this time |
| 3 | 0 | ↑ 100% | Nothing to compare with; Replyco shows 100% |
An arrow up appears at 100% or more, an arrow down below 100%. Green means better and red means worse, so for Not Resolved Tickets, Snoozed Tickets, Archived Tickets, Messages In Process, Message Errors, every overdue card and the three average times an arrow up is red. When every previous value in a widget is 0, the widget shows no percentages at all.
Choose the period
Section titled “Choose the period”-
Select the period button at the right of the header. It reads Last 7 days when you open the dashboard.
-
Under Select period, select Today, Yesterday, Last 7 days, Last 30 days or Last 90 days. For other dates, pick a start and an end date under Or select custom dates.
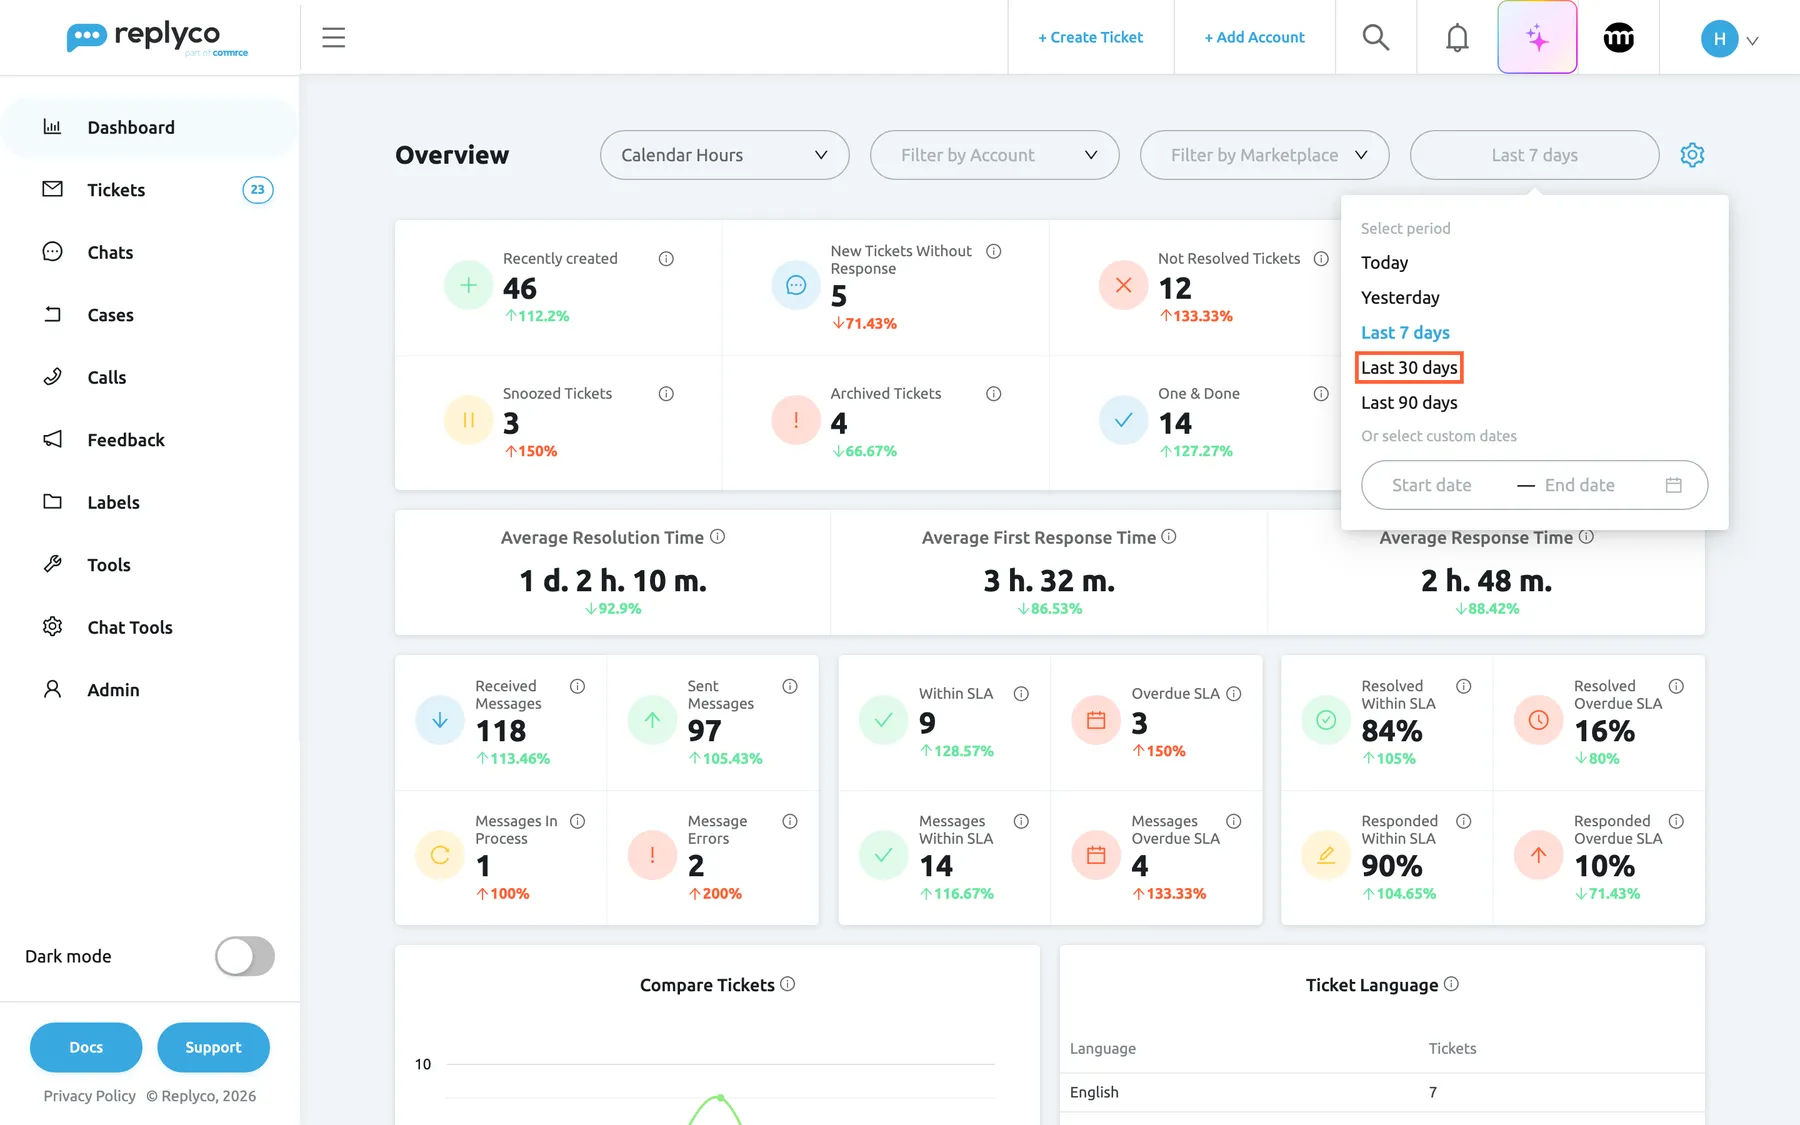
Pick a preset period or your own dates; the dashboard compares it with the same number of days just before. What this screenshot shows
- Screen
- Overview (/dashboard/overview)
- Highlighted
- option “Last 30 days”, header-right, enabled. reloads the dashboard for the last 30 days
- Also visible
- period panel: Today, Yesterday, Last 7 days (selected), Last 30 days, Last 90 days; custom range field with Start date and End date
- Purpose
- choose the period the dashboard counts
-
The panel closes and every widget reloads for the new period. A custom period shows its dates on the button.
The period runs from the start of its first day to the end of its last day, in your own local days: Replyco stores all data in UTC and converts the dates you choose into UTC for the search. Last 7 days includes today and the seven days before it, eight calendar days, and Last 30 days and Last 90 days work the same way.
The dashboard does not remember your choice: every time you open it, it starts again at Last 7 days with no account or marketplace filter. The period also travels with you when you open the tickets behind a card.
Filter by account and marketplace
Section titled “Filter by account and marketplace”-
Select Filter by Account in the header and tick one or more accounts, or Select all.
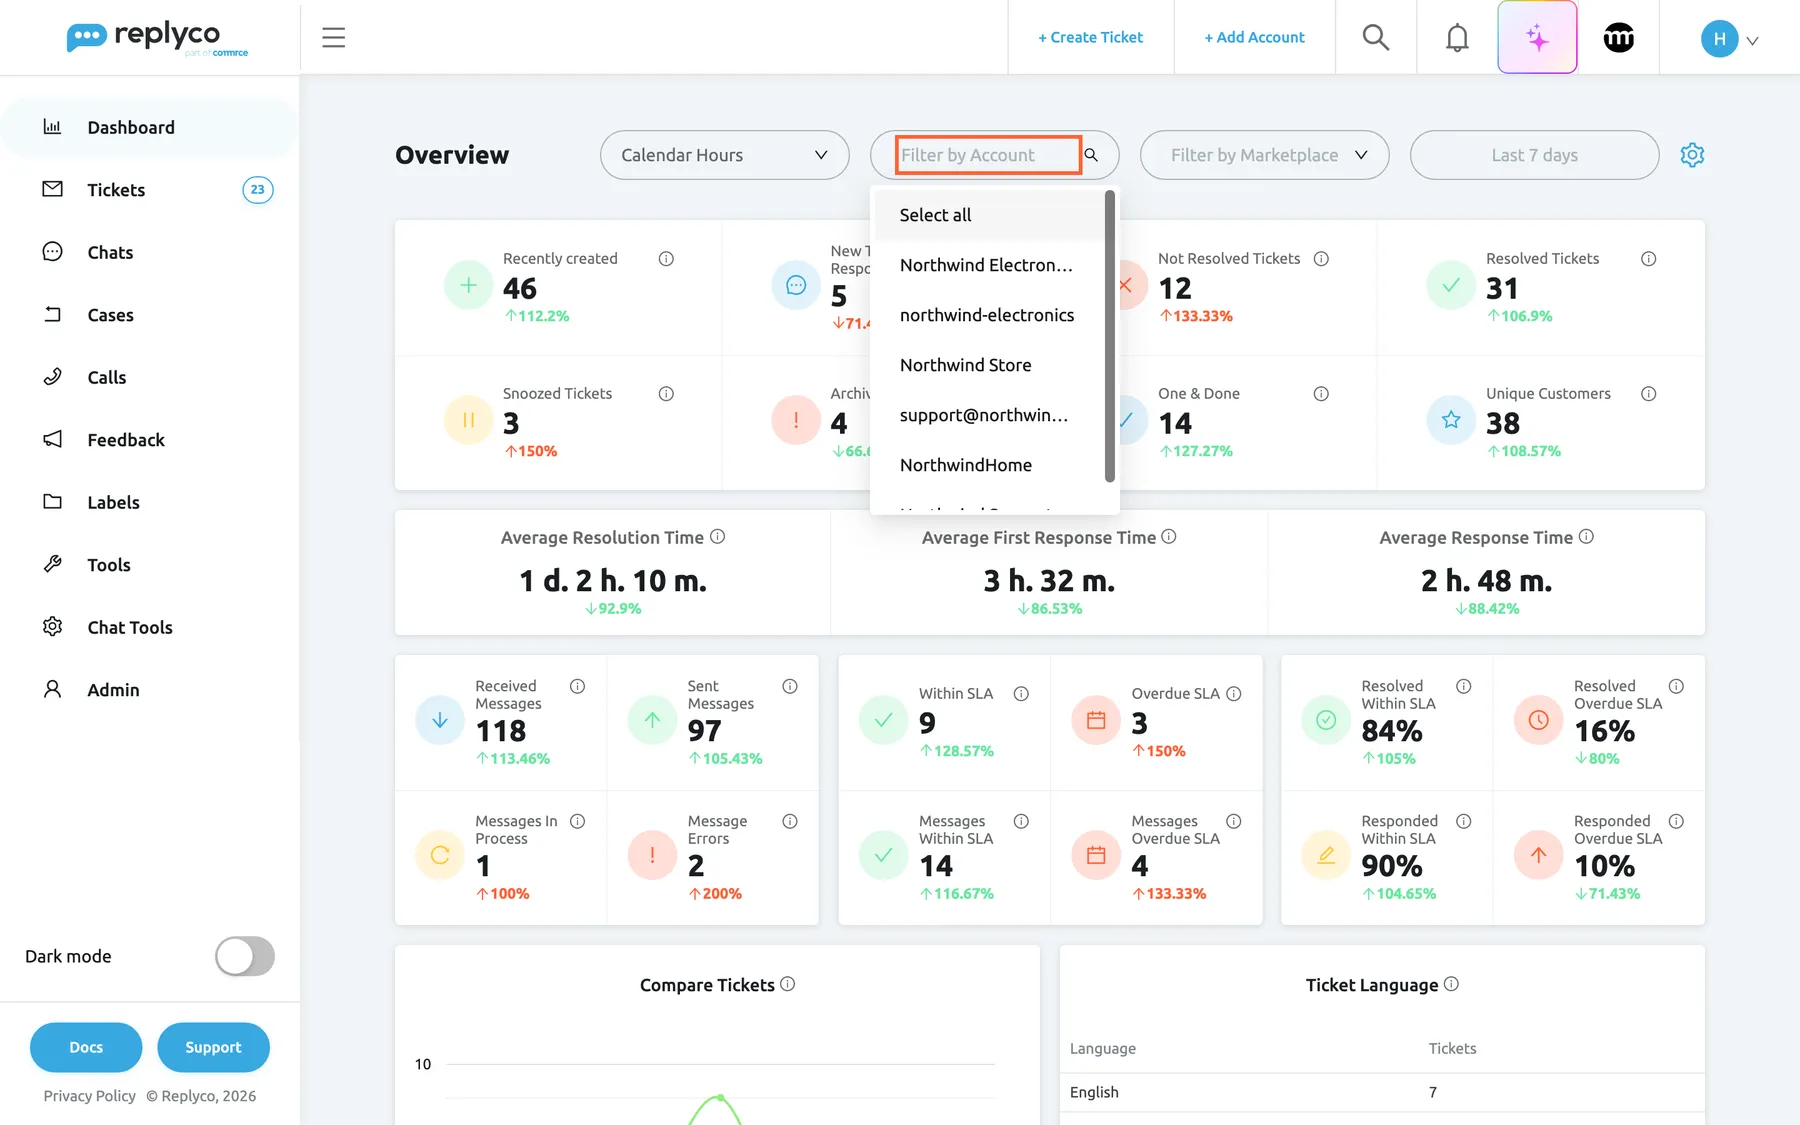
Filter by Account and Filter by Marketplace narrow every widget; leave them empty to count all accounts. What this screenshot shows
- Screen
- Overview (/dashboard/overview)
- Highlighted
- combobox “Filter by Account”, header, expanded. limits every widget to the ticked accounts
- Also visible
- option Select all; six Northwind accounts; Filter by Marketplace and Last 7 days beside it
- Purpose
- narrow the dashboard to accounts
-
To look at a channel instead, select Filter by Marketplace and tick one or more marketplaces.
-
Every widget reloads as soon as you tick or clear an entry. Clear the filter to count all accounts again.
Both filters apply together: ticking the Amazon marketplace and an eBay account counts nothing, because no ticket is both. The marketplace list offers every channel type Replyco imports tickets from, whether you have connected it or not. Ticket numbers are filtered by the account the customer wrote to, message numbers by the account of each message, and Buyer locations by the account of each order.
Example. Northwind Electronics sells on Amazon and eBay and runs its own shop. To see whether the new eBay listings bring more questions, the team lead ticks the eBay account under Filter by Account and compares Recently created for the last 30 days with the month before.
Measure response and resolution times
Section titled “Measure response and resolution times”The Average time widget shows three averages, written in days, hours and minutes (for example 1 d. 2 h. 10 m.). A dash means there was nothing to measure.
| Card | Measured from | Measured to | Which tickets or messages |
|---|---|---|---|
| Average Resolution Time | The ticket’s creation | The first time it was resolved | Tickets created in the period that have been resolved |
| Average First Response Time | The ticket’s creation | Your team’s first reply | Tickets started by a customer message dated in the period that have been answered |
| Average Response Time | Each message received | The next reply from your team | Messages received in the period that were followed by a reply |
Auto-responses never count as a reply, so an instant auto-response does not make the team look fast. Messages and tickets still waiting for a reply are not in the averages; to see those, use Overdue SLA and New Tickets Without Response. Archived tickets and tickets of blocked customers are left out of all three times.
Each card has an information icon with the product’s own definition. Hover over it to read it.
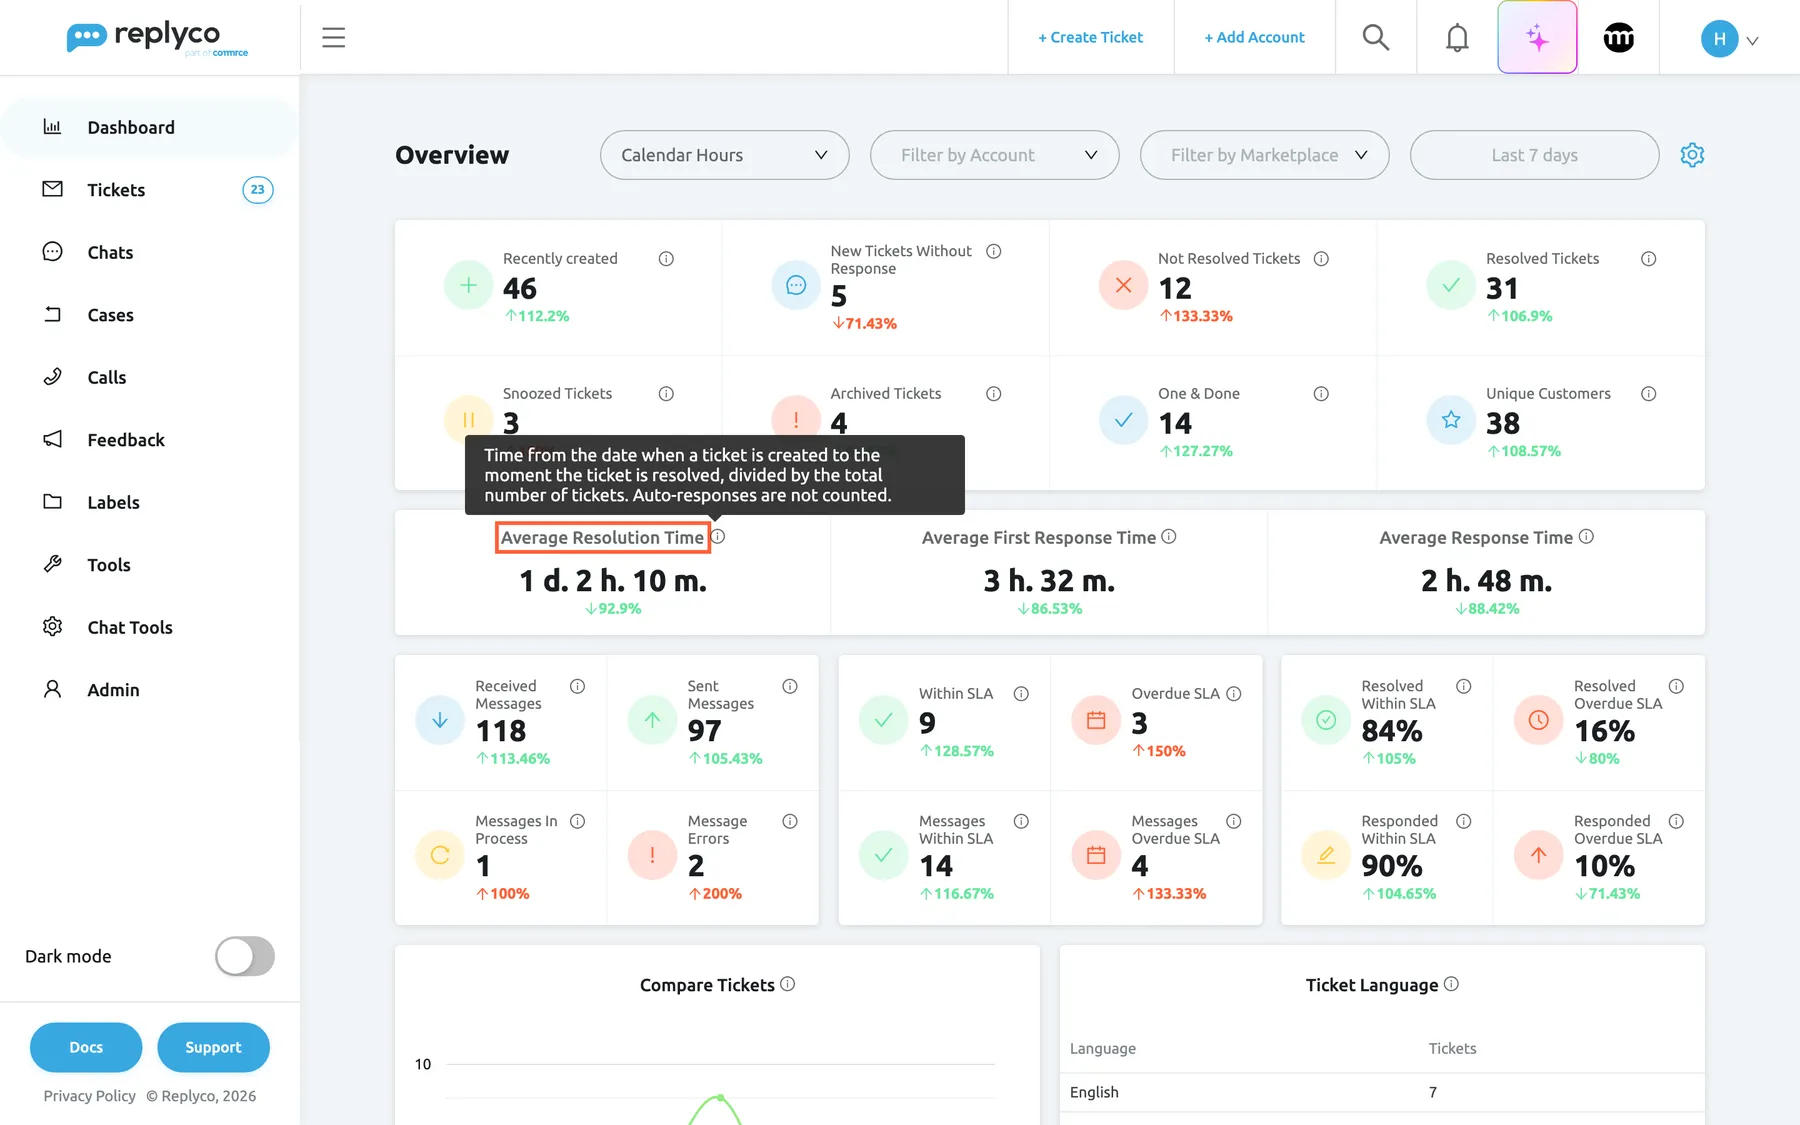
What this screenshot shows
- Screen
- Overview (/dashboard/overview)
- Highlighted
- heading “Average Resolution Time”, average-times-widget, tooltip-open. explains how the resolution time is measured
- Also visible
- tooltip with the definition of Average Resolution Time; Average Resolution Time 1 d. 2 h. 10 m.; Average First Response Time and Average Response Time beside it
- Purpose
- read a number's definition
Example. A customer writes on Friday at 17:00 and Laura Graf answers on Monday at 09:00. In calendar hours that first response took 2 d. 16 h.; in working hours from 09:00 to 18:00 it took 1 h. See Count only working hours.
Count only working hours
Section titled “Count only working hours”-
Select the first select in the header, which reads Calendar Hours.
-
Select Working Hours. The three average times reload.
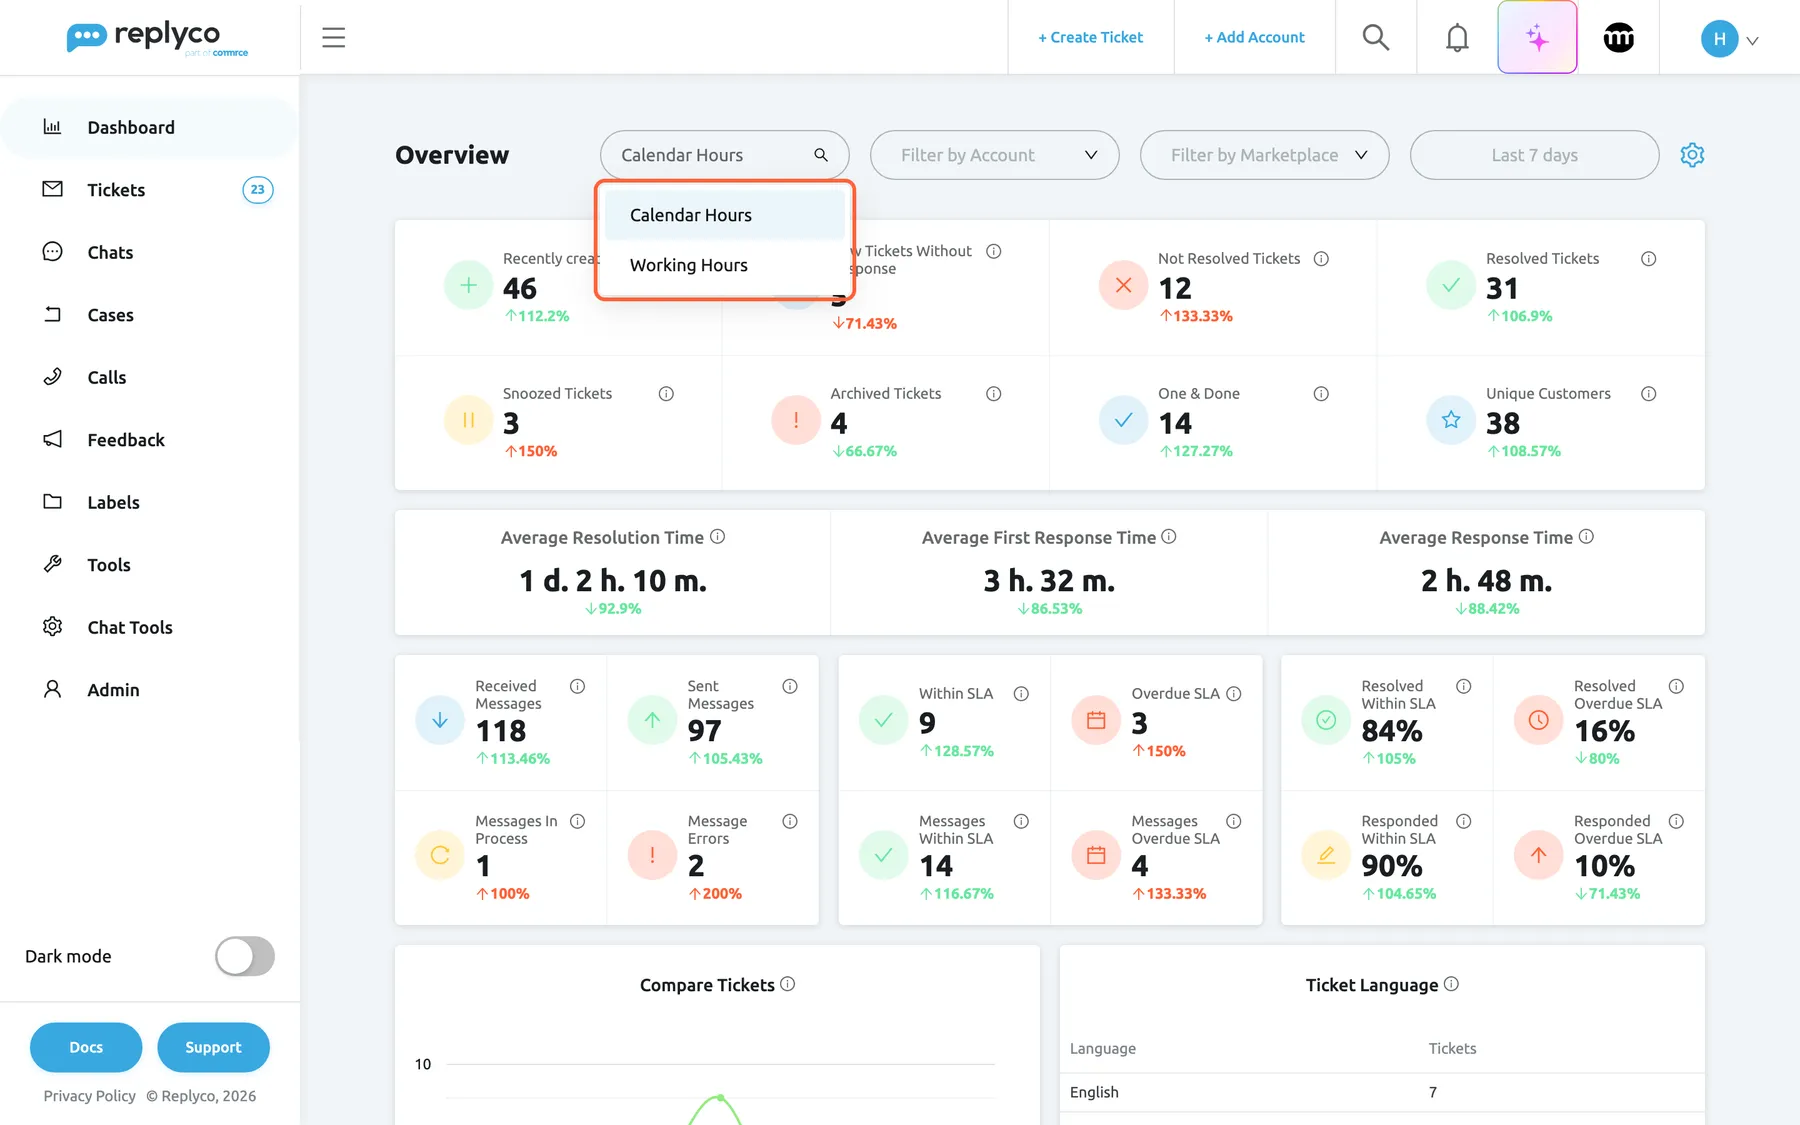
Working Hours makes the three average times count only your company's working hours. What this screenshot shows
- Screen
- Overview (/dashboard/overview)
- Highlighted
- listbox “”, header-left, expanded. Working Hours recalculates the average times in working hours
- Also visible
- options Calendar Hours (selected) and Working Hours; average times widget behind the list
- Purpose
- choose how the average times are measured
With Working Hours, Average Resolution Time, Average First Response Time and Average Response Time count only the time between your company’s start and end time. The start and end time are the ones under Active between in the Working Time card of Company Settings. The other widgets do not change.
The select starts on the choice set in your own account: turn on Use Working Hours in Dashboards in Account Settings to open every dashboard in working hours. A change in the header lasts until you leave the dashboard.
Check your deadlines
Section titled “Check your deadlines”The two SLA widgets count only tickets with a priority that were created in the period, because only a priority gives a ticket a respond-by and a resolve-by. To give tickets priorities and deadlines, see Ticket priorities and SLA.
| Card | What it counts |
|---|---|
| Within SLA | Open tickets created in the period that wait for your reply and whose respond-by is still ahead |
| Overdue SLA | The same, with the respond-by passed |
| Messages Within SLA | Customer messages on open tickets answered before their respond target, or still waiting within it |
| Messages Overdue SLA | Customer messages on open tickets answered late, or still waiting past their target |
| Resolved Within SLA | Of the resolved tickets with a priority, the share resolved by their resolve-by |
| Resolved Overdue SLA | The share resolved after it |
| Responded Within SLA | Of the answered tickets with a priority, the share whose last reply came by the respond-by |
| Responded Overdue SLA | The share whose last reply came after it |
The ticket counts describe right now: a ticket counts as overdue the moment its respond-by passes, even in a past period. The message cards measure each customer message against its own target and the first reply after it; auto-responses do not count as that reply. The share cards show whole percentages, rounded down. The four count cards leave archived tickets out; the share cards include them.
Selecting Within SLA or Overdue SLA opens those tickets in All Tickets with the matching deadline filter. Snoozed tickets are counted but not listed.
Check messages in, out and stuck
Section titled “Check messages in, out and stuck”The Information about messages widget counts messages dated in the period, on tickets of every age.
| Card | What it counts |
|---|---|
| Received Messages | Messages from customers |
| Sent Messages | Messages from your side, including auto-responses and messages sent outside Replyco |
| Messages In Process | Your messages still being sent |
| Message Errors | Your messages that failed to send |
Messages In Process and Message Errors open All Tickets filtered to tickets with such messages. Both leave out messages on archived tickets. Check Message Errors daily: a failed reply means a customer has not heard from you. To send it again, open the ticket; see The ticket screen.
Open the tickets behind a number
Section titled “Open the tickets behind a number”-
Select a card, for example Not Resolved Tickets.
-
Replyco opens the ticket list with the dashboard’s period, accounts and marketplaces as filters, plus the card’s own filter.
The ticket list shows fewer tickets than the card when some of them are archived or snoozed: the cards count them, All Tickets does not list them. Cards for messages, times and shares are not links. How filters work in the list is explained in Ticket lists.
Compare tickets day by day
Section titled “Compare tickets day by day”The Compare Tickets chart draws three lines, one point per day on which tickets were created:
- Created: tickets created that day;
- Responded: of those, the tickets your team has answered, auto-responses included;
- Resolved: of those, the tickets resolved now.
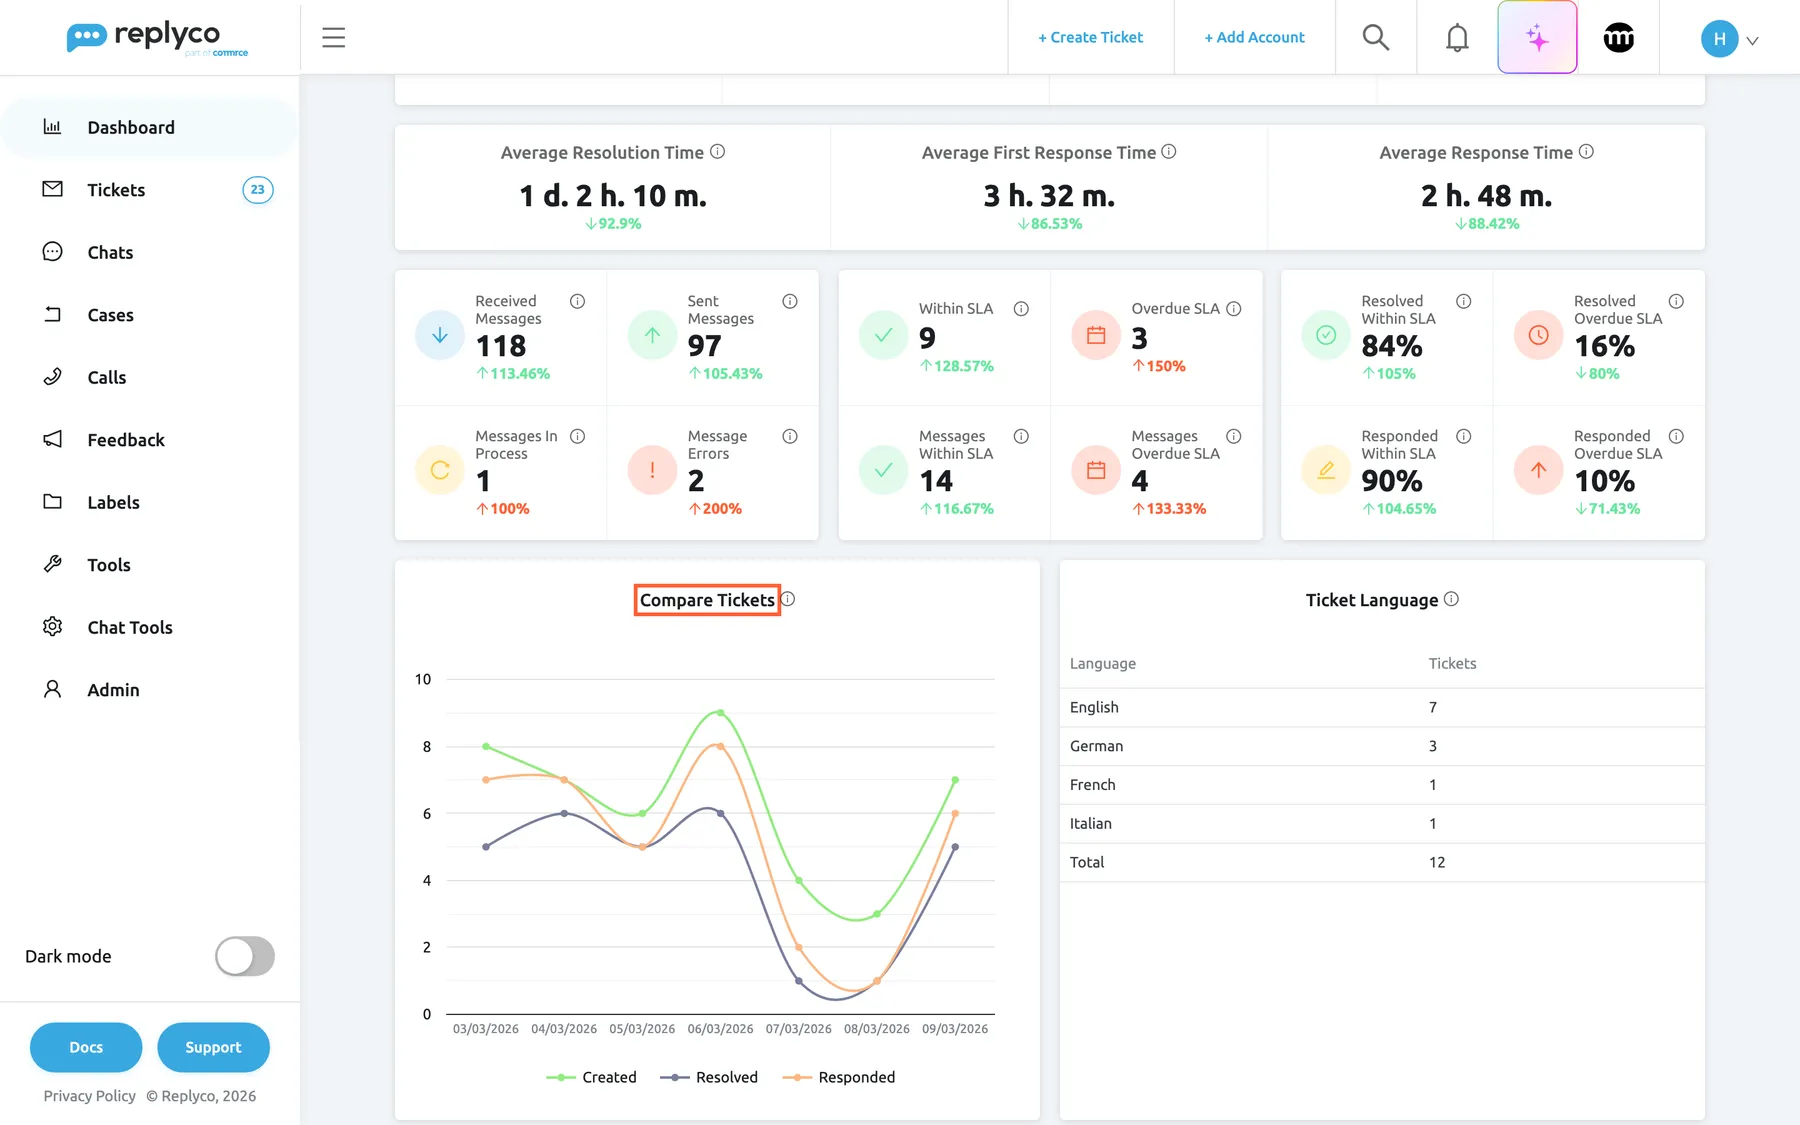
What this screenshot shows
- Screen
- Overview (/dashboard/overview)
- Highlighted
- heading “Compare Tickets”, compare-tickets-widget, enabled. shows created, resolved and responded tickets per day
- Also visible
- line chart with Created, Resolved and Responded from 3 to 9 March; Ticket Language table: English 7, German 3, French 1, Italian 1, Total 12
- Purpose
- compare incoming and handled tickets day by day
When Resolved stays well below Created day after day, the open backlog grows. Hover over a point to see the exact numbers.
See ticket languages and buyer countries
Section titled “See ticket languages and buyer countries”Ticket Language lists the tickets created in the period that wait for your reply, by the language of the customer’s last message, with a Total row. The languages are named in the language of your screen. Tickets whose language Replyco could not tell are left out. To have these messages translated, see Translations.
Buyer locations counts orders, not tickets: every order created or bought in the period, by the country of its shipping address, or the billing or customer address when there is none. The map shades each country by its number of orders; hover over a country to see it. The table lists Country and Order Count, the highest first, five per page.
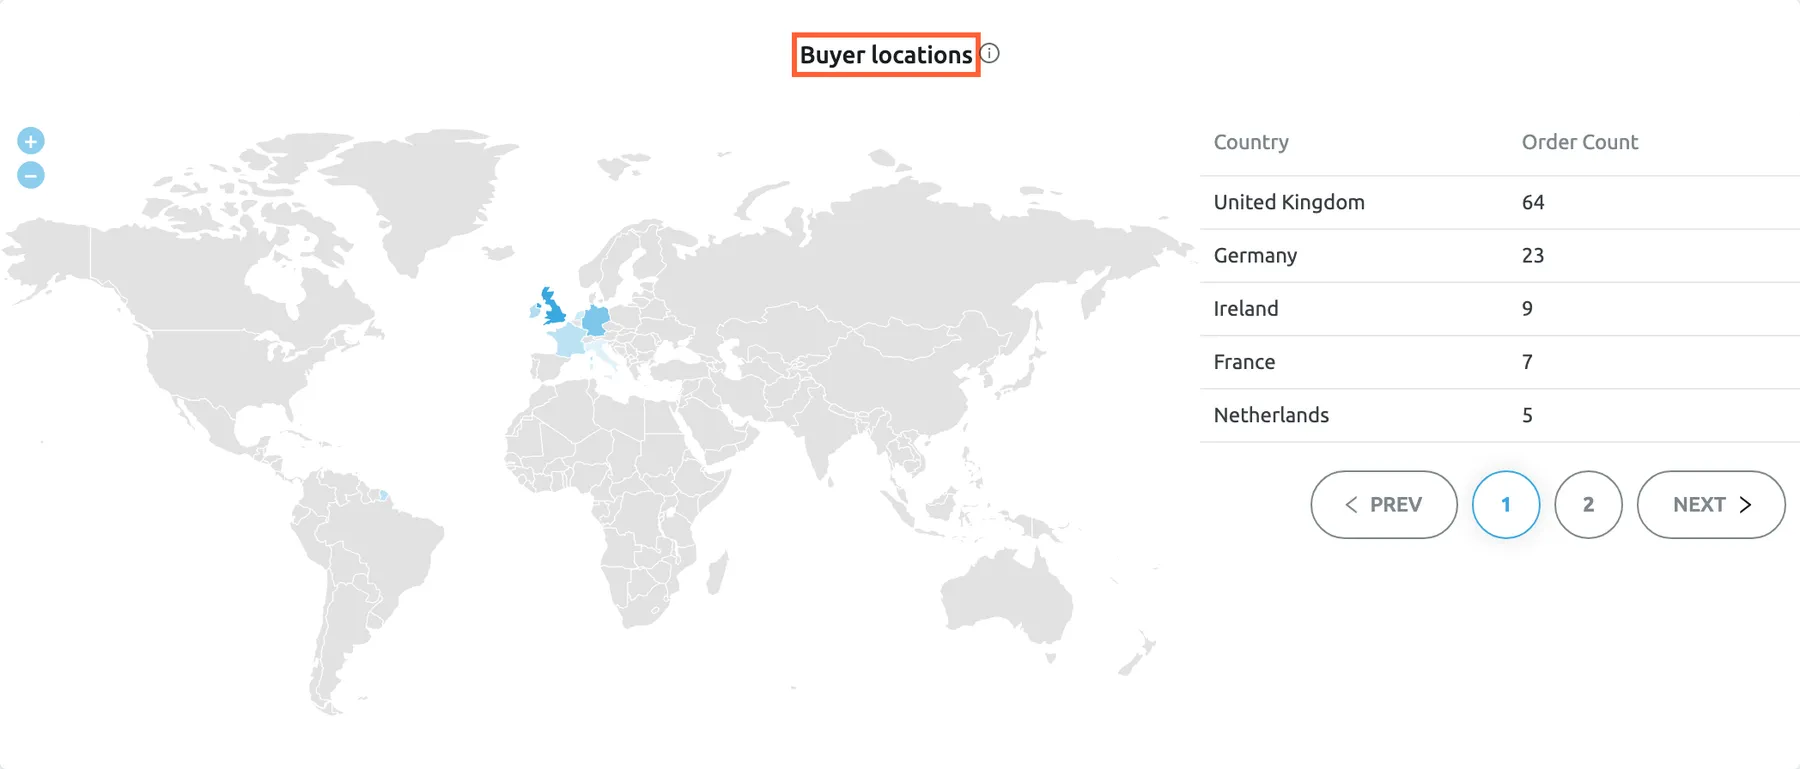
What this screenshot shows
- Screen
- Overview (/dashboard/overview)
- Highlighted
- heading “Buyer locations”, buyer-locations-widget, enabled. shows orders per country on a map and in a table
- Also visible
- world map with six shaded countries; table Country and Order Count: United Kingdom 64, Germany 23, Ireland 9, France 7, Netherlands 5; second table page for Italy
- Purpose
- see where orders come from
Example. Northwind Electronics sees 23 German orders a week but only three German tickets waiting. The team decides a German-speaking colleague for two hours a day is enough.
Find products with unhappy customers
Section titled “Find products with unhappy customers”Average tone by product ranks up to 25 products by the average tone of the customer messages on their tickets, worst first, on a scale from 0 (furious) to 1 (delighted). A product appears once at least 3 messages on its tickets have been scored. Bars are red below 0.40, grey from 0.40 to 0.60 and green above. Hover over a bar for the product, its average tone and the number of tickets; select it to open the product’s page on its sales channel.
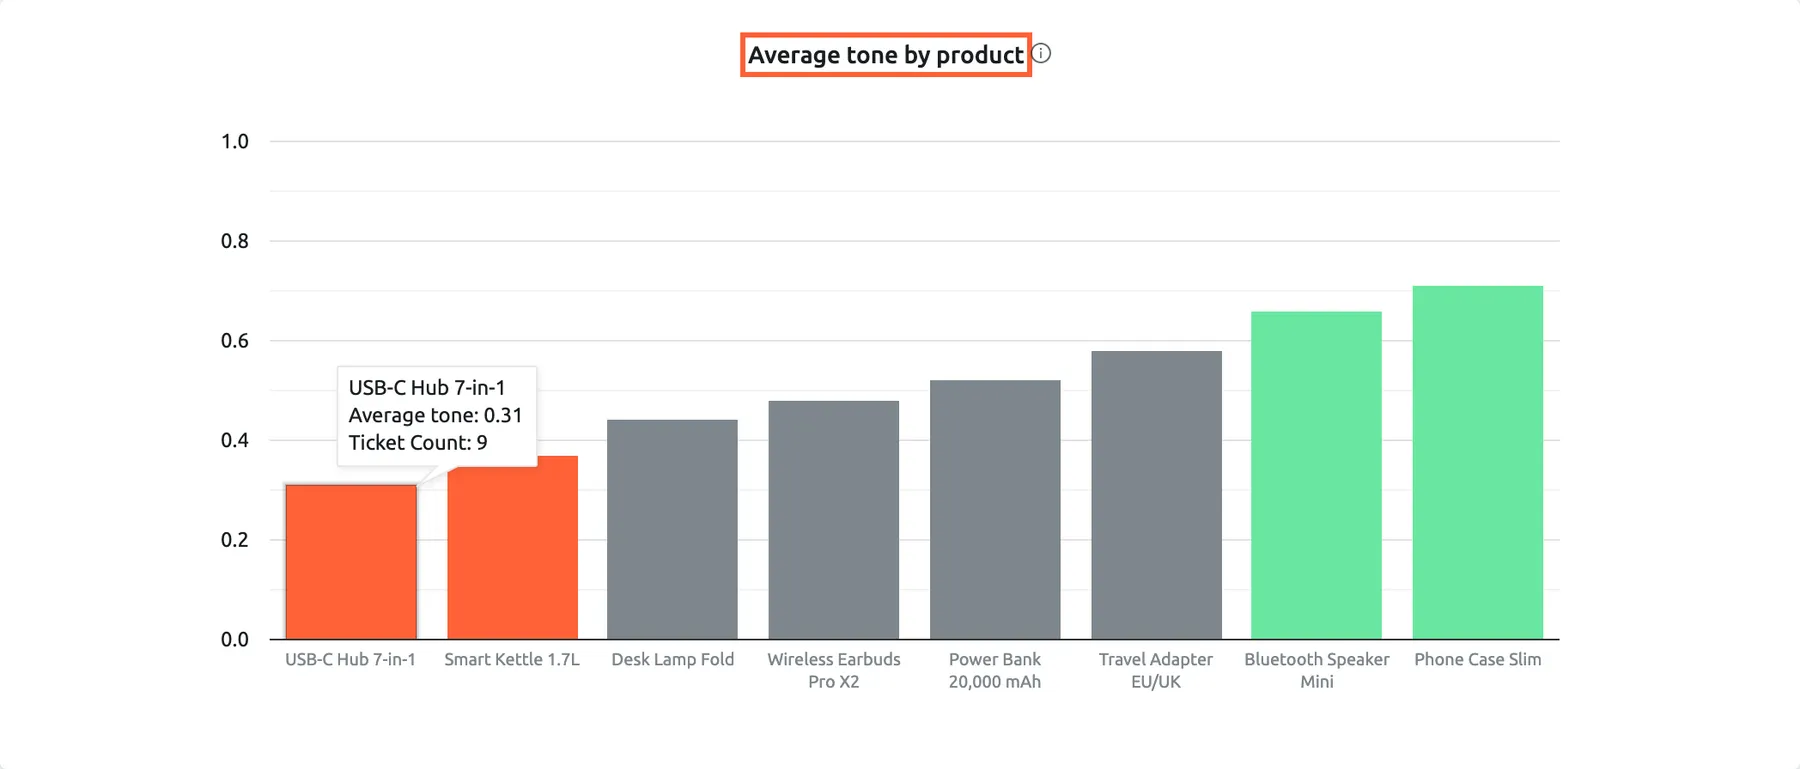
What this screenshot shows
- Screen
- Overview (/dashboard/overview)
- Highlighted
- heading “Average tone by product”, tone-widget, bar-hovered. shows a product's average tone and ticket count; a click opens the product page
- Also visible
- eight bars: two red, four grey, two green; tooltip USB-C Hub 7-in-1, average tone 0.31, 9 tickets
- Purpose
- find the products behind unhappy customers
The widget is shown only while your company has Replyco AI and tone analysis is switched on; until enough messages are scored it reads No tone data yet — scores appear as new messages arrive. It uses the ticket’s creation date for the period and includes archived tickets and blocked customers. How scores are made and every rule behind the widget are in Message tone analysis.
Arrange your dashboard
Section titled “Arrange your dashboard”To hide or show widgets:
-
Select the gear icon at the right of the header, then Manage Widgets.
-
Clear a check box to remove that widget, or tick it to add the widget back. The change is saved at once; the header shows Saving... meanwhile.
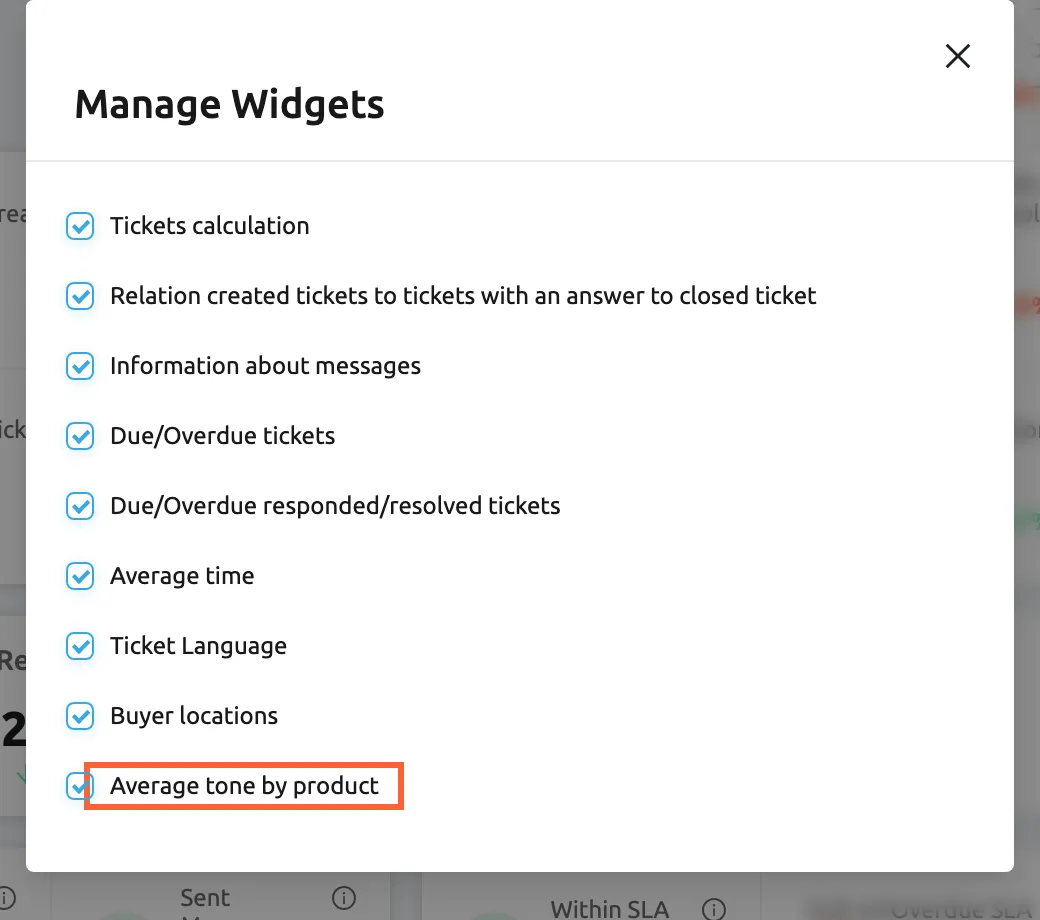
Manage Widgets shows or hides each widget on your own copy of the dashboard. What this screenshot shows
- Screen
- Overview (/dashboard/overview)
- Highlighted
- checkbox “Average tone by product”, dialog, checked. hides or shows the Average tone by product widget
- Also visible
- nine widget check boxes, all ticked; close button
- Purpose
- choose which widgets you see
To move, resize or remove widgets:
-
Select the gear icon, then Turn ON Edit Mode.
-
Drag a widget to a new place, or drag the handle in its bottom right corner to resize it. Each change is saved when you let go.
-
To remove a widget, select the cross in its top right corner and confirm Are you sure you want to delete this Widget? with Yes.
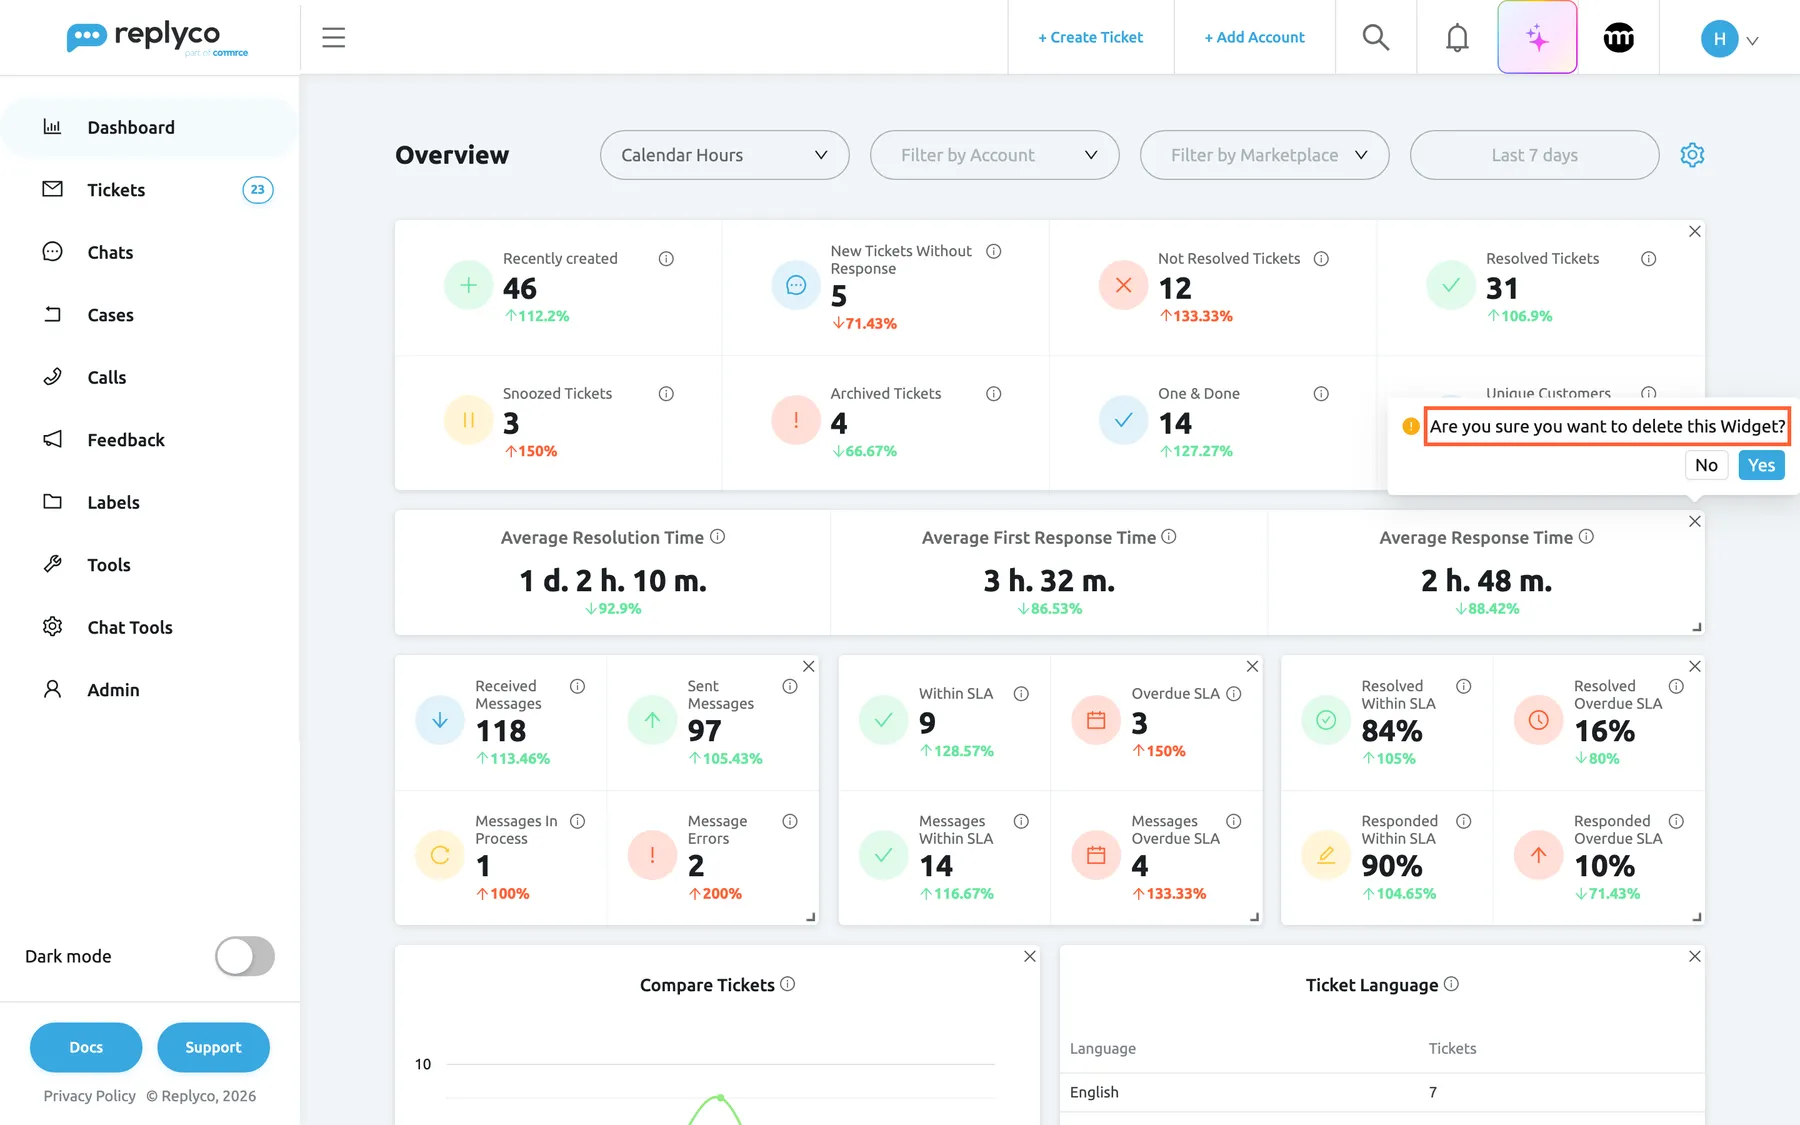
In edit mode you drag, resize and remove widgets; the layout is saved for your user only. What this screenshot shows
- Screen
- Overview (/dashboard/overview)
- Highlighted
- dialog “Are you sure you want to delete this Widget?”, average-times-widget, open. Yes removes the widget from your layout
- Also visible
- a cross and a resize handle on every widget; confirmation with No and Yes
- Purpose
- rearrange or remove widgets
-
Select the gear icon, then Turn OFF Edit Mode.
The layout belongs to your user: colleagues keep their own. A widget you add back is placed at the bottom in its standard size. Removing the last widget brings back the whole standard layout. Hiding a widget only changes what you see; nothing is deleted.
Every control, explained
Section titled “Every control, explained”Overview in the sidebar
Section titled “Overview in the sidebar”The sidebar, under Dashboard, the first dashboard of the menu.
Opens the Overview dashboard. It is shown only when an admin has given your user the Overview dashboard; without any dashboard, the whole Dashboard menu is hidden.
Overview is the one dashboard every role gets by default, so it is the shared starting point for talking about the week.
Calendar Hours and Working Hours
Section titled “Calendar Hours and Working Hours”The first select in the header.
Calendar Hours measures the three average times around the clock; Working Hours counts only the time between your company’s start and end time. It starts on the choice of Use Working Hours in Dashboards in your Account Settings; changing it here is not saved.
A reply on Monday morning to a Friday evening message is fast for a team that does not work weekends; working hours show that.
Filter by Account
Section titled “Filter by Account”The second select in the header.
Lists your connected accounts with Select all at the top. Ticking accounts narrows every widget to them at once; empty means every account.
Compare your shop and marketplace accounts, or check one account after a change such as new listings.
Filter by Marketplace
Section titled “Filter by Marketplace”The third select in the header.
Lists every channel type Replyco imports tickets from, with Select all. Ticking marketplaces narrows every widget at once; it combines with Filter by Account.
See one channel across all its accounts, for example every Amazon account together.
The period button
Section titled “The period button”The fourth control in the header; it shows the period, Last 7 days at first, or the dates you picked.
Opens Select period with Today, Yesterday, Last 7 days, Last 30 days, Last 90 days and a date range under Or select custom dates. Each preset includes today. Not saved.
Weekly and monthly reviews need fixed periods; a custom range answers questions about a campaign or a holiday season.
The gear icon
Section titled “The gear icon”At the right end of the header.
Opens a menu with Turn ON Edit Mode (or Turn OFF Edit Mode while editing) and Manage Widgets.
Each person looks for different numbers; the gear lets everyone keep the widgets they use.
Manage Widgets
Section titled “Manage Widgets”Gear icon › Manage Widgets; a dialog with one check box per widget.
Ticking or clearing a box adds or removes the widget in your layout at once. The widget names in the dialog differ from the titles on the screen; see Widgets.
Hide what you never read so the numbers you need fit on one screen.
Edit mode and the cross on each widget
Section titled “Edit mode and the cross on each widget”Gear icon › Turn ON Edit Mode. Each widget then has a cross at the top right and a resize handle at the bottom right.
Drag to move, drag the handle to resize, select the cross and Yes to remove the widget from your layout. Every change is saved for your user.
Put the widgets you check every morning at the top.
Information icons
Section titled “Information icons”Next to every card and widget title.
Hovering shows the product’s definition of the number.
Two people reading the same number should mean the same thing.
Widgets
Section titled “Widgets”| Name in Manage Widgets | Title on the screen | Why |
|---|---|---|
| Tickets calculation | Eight cards from Recently created to Unique Customers | Workload and outcome of the period |
| Relation created tickets to tickets with an answer to closed ticket | Compare Tickets | Whether the team keeps up day by day |
| Information about messages | Received Messages, Sent Messages, Messages In Process, Message Errors | Message volume and replies that failed |
| Due/Overdue tickets | Within SLA, Overdue SLA and the two message cards | Deadlines at risk now |
| Due/Overdue responded/resolved tickets | The four share cards from Resolved Within SLA to Responded Overdue SLA | Deadlines kept over the period |
| Average time | Average Resolution Time, Average First Response Time, Average Response Time | Speed of the team |
| Ticket Language | Ticket Language | Languages waiting for a reply |
| Buyer locations | Buyer locations | Where orders go |
| Average tone by product | Average tone by product | Products behind unhappy customers; only with tone analysis on |
Who sees what
Section titled “Who sees what”| Part of the screen | What decides whether you see it |
|---|---|
| Overview in the sidebar | The Overview dashboard in your user’s dashboards, set by an admin on the Access Rights tab of Users. Choosing a role preselects dashboards, for example only Overview for the basic user role. |
| The whole Dashboard menu | At least one dashboard given to your user |
| Average tone by product | Replyco AI, which every plan includes, and Message Tone Analysis switched on in AI Settings |
| Numbers in the SLA widgets | Priorities with deadlines, which every current plan includes; see What each plan includes |
| Your layout | Only you |
The Overview dashboard itself needs no add-on. For how dashboards are given to users, see User permissions and roles.
What you need to know
Section titled “What you need to know”| Topic | Fact |
|---|---|
| Default period | Last 7 days: today and the seven days before, reset every time you open the dashboard |
| Comparison | Current value as a share of the same number of days just before; 100% when there is nothing to compare with |
| Which date counts | Tickets by creation date; messages by message date; orders by order or purchase date |
| Current state | Resolved, snoozed, archived and overdue describe each ticket now, not at the end of the period |
| Left out | Tickets of blocked customers and the welcome ticket; archived tickets in the three average times, the four SLA count cards, Messages In Process and Message Errors |
| Auto-responses | Not a reply for the times and deadlines; counted in Sent Messages and as Responded in the chart |
| Working hours | Only the time between your company’s start and end time counts for the three average times |
| Company-wide | Numbers cover the whole company; only the filters narrow them |
| Layout | Saved per user; filters and period are not saved |
| Refresh | Numbers load when you open the dashboard or change a filter; there is no refresh button, so open the dashboard again to update |
Frequently asked questions
Section titled “Frequently asked questions”Reading the numbers
Section titled “Reading the numbers”Why does a card say ↑ 100% when nothing changed?
Section titled “Why does a card say ↑ 100% when nothing changed?”The percentage under a number on DashboardOverview is the current value as a share of the previous period, not the change. 100% means the same as before, or that the previous period had nothing to compare with. A card that doubled reads 200%, and one that halved reads 50%.
Which period is the comparison made with?
Section titled “Which period is the comparison made with?”Replyco compares with the same number of days immediately before your period. For Last 7 days, which covers today and the seven days before, that is the eight days before those. The accounts and marketplaces you ticked apply to both periods.
Why is last week’s number different today from what I saw last week?
Section titled “Why is last week’s number different today from what I saw last week?”The Overview dashboard counts tickets created in the period by their state now. A ticket that was open last week and was resolved or archived since then moves from Not Resolved Tickets to Resolved Tickets or Archived Tickets. Write the numbers down at the end of a week if you want to keep them.
Which tickets count as done after one reply?
Section titled “Which tickets count as done after one reply?”One & Done on the Overview dashboard counts tickets created in the period that are resolved and have exactly two messages: the customer’s message and one reply from your team. A ticket where the customer wrote twice, or your team replied twice, does not count.
Are auto-responses counted as responses?
Section titled “Are auto-responses counted as responses?”Not for the times and deadlines: Average First Response Time, Average Response Time and the SLA cards wait for a reply from a person. Auto-responses are counted in Sent Messages and make a ticket count as Responded in the Compare Tickets chart.
Why does the resolution time show a dash?
Section titled “Why does the resolution time show a dash?”A dash in Average Resolution Time means none of the tickets created in the period has been resolved yet, so there is nothing to average. Choose a longer period on DashboardOverview, or resolve finished tickets, and the time appears.
Periods and filters
Section titled “Periods and filters”How do I see last month?
Section titled “How do I see last month?”Select the period button on DashboardOverview and pick the first and last day of the month under Or select custom dates. Last 30 days is not the same: it always ends today and includes today.
Can the dashboard remember my filters?
Section titled “Can the dashboard remember my filters?”No. Every time you open a dashboard it starts at Last 7 days with no account or marketplace ticked. Only the Calendar Hours or Working Hours choice has a saved default: Use Working Hours in Dashboards in your Account Settings.
Why do my colleague and I see different numbers?
Section titled “Why do my colleague and I see different numbers?”The numbers on DashboardOverview are company-wide, so the same period and filters give the same numbers to everyone. Check that you both use the same period, the same accounts and marketplaces, and the same choice between Calendar Hours and Working Hours.
Working hours and deadlines
Section titled “Working hours and deadlines”Which working hours does the dashboard use?
Section titled “Which working hours does the dashboard use?”With Working Hours, the three average times count only the time between the start and end time set under Working Time in Company Settings. With Calendar Hours they count around the clock, nights and weekends included.
Why are my SLA cards all zero?
Section titled “Why are my SLA cards all zero?”The deadline cards on DashboardOverview count only tickets with a priority, because only a priority sets a respond-by and a resolve-by. If no rule or person sets priorities, every SLA card stays at 0. To set priorities up, see Ticket priorities and SLA.
Does a ticket that is overdue now count as overdue in an old period?
Section titled “Does a ticket that is overdue now count as overdue in an old period?”Yes. Within SLA and Overdue SLA look at open tickets created in the period and compare their respond-by with the current time. A ticket from last month that still waits for a reply counts as overdue when you look at last month.
Tickets and widgets
Section titled “Tickets and widgets”Why does the ticket list show fewer tickets than the card?
Section titled “Why does the ticket list show fewer tickets than the card?”The cards on DashboardOverview count archived and snoozed tickets, but All Tickets does not list them. The list opens with the dashboard’s period, accounts and marketplaces as filters, plus the card’s own filter. Open Archive or Snoozed to find the rest.
Where did the product tone widget go?
Section titled “Where did the product tone widget go?”Average tone by product is shown only while your company has Replyco AI and tone analysis is switched on in AI Settings. If both are on, you may have removed it: add it back with the gear icon and Manage Widgets.
I removed a widget by mistake. How do I get it back?
Section titled “I removed a widget by mistake. How do I get it back?”On DashboardOverview, select the gear icon, then Manage Widgets, and tick the widget again. It comes back at the bottom of the dashboard in its standard size; move it with Turn ON Edit Mode. Only your own layout changes.
Who can see the Overview dashboard?
Section titled “Who can see the Overview dashboard?”Everyone whose user has the Overview dashboard in their dashboards. An admin sets this on the Access Rights tab of each user in Users. Without any dashboard, the whole Dashboard menu is hidden for that user.
Troubleshooting
Section titled “Troubleshooting”| Symptom | What to check |
|---|---|
| The Dashboard menu or Overview is missing | Your user’s dashboards on the Access Rights tab in Users; ask an admin |
| A widget shows No data... | The period and filters: widen the period, clear Filter by Account and Filter by Marketplace; for SLA widgets, whether tickets have priorities |
| Every percentage reads ↑ 100% | The previous period had no tickets, for example right after you connected your first account; expected |
| Average Resolution Time shows a dash | No ticket created in the period is resolved yet; widen the period |
| The average times look too high after nights and weekends | Switch to Working Hours; then check the start and end time under Working Time |
| The ticket list opened from a card shows fewer tickets | Archived and snoozed tickets are counted but not listed; check Archive and Snoozed |
| Average tone by product is missing or reads No tone data yet — scores appear as new messages arrive | Tone analysis on in AI Settings; at least 3 scored messages per product in the period |
| A widget keeps its grey bars | Reload the page; if it stays, note the widget and the time for support |