

Users dashboard
The Users dashboard shows what each person on your team did in a period: tickets assigned, answered, resolved, snoozed and archived, messages received and sent, deadlines kept or missed, and how long first replies, replies and resolutions took. It opens with all users side by side; pick one user to see their figures as cards, each compared with the previous period. Open it from DashboardUsers in the sidebar. The dashboard shows the figures of every user of the company.
What you can do here
Section titled “What you can do here”- Compare everyone at once. The All Users view has 17 small tables, one per figure, with every user and their number. Compare all users
- Look at one user. Pick a name in the user filter and the dashboard shows that person’s figures as cards with a percentage against the previous period. Look at one user
- Measure times in working hours. Switch from calendar hours to working hours, so nights and weekends do not count against your team. Choose calendar or working hours · Working time
- See who keeps their deadlines. Tables of tickets within and past their respond-by deadline, and three average times per user. Read deadlines and times · Ticket priorities and SLA
- Narrow the figures. Filter by account, marketplace and period. Filter by account, marketplace and period
- Open a user’s tickets. Names and cards lead to the ticket list of that user with the matching status. Open a user’s tickets
- Arrange both views. The All Users view and the one-user view each keep their own layout for you. Arrange the widgets
The screen at a glance
Section titled “The screen at a glance”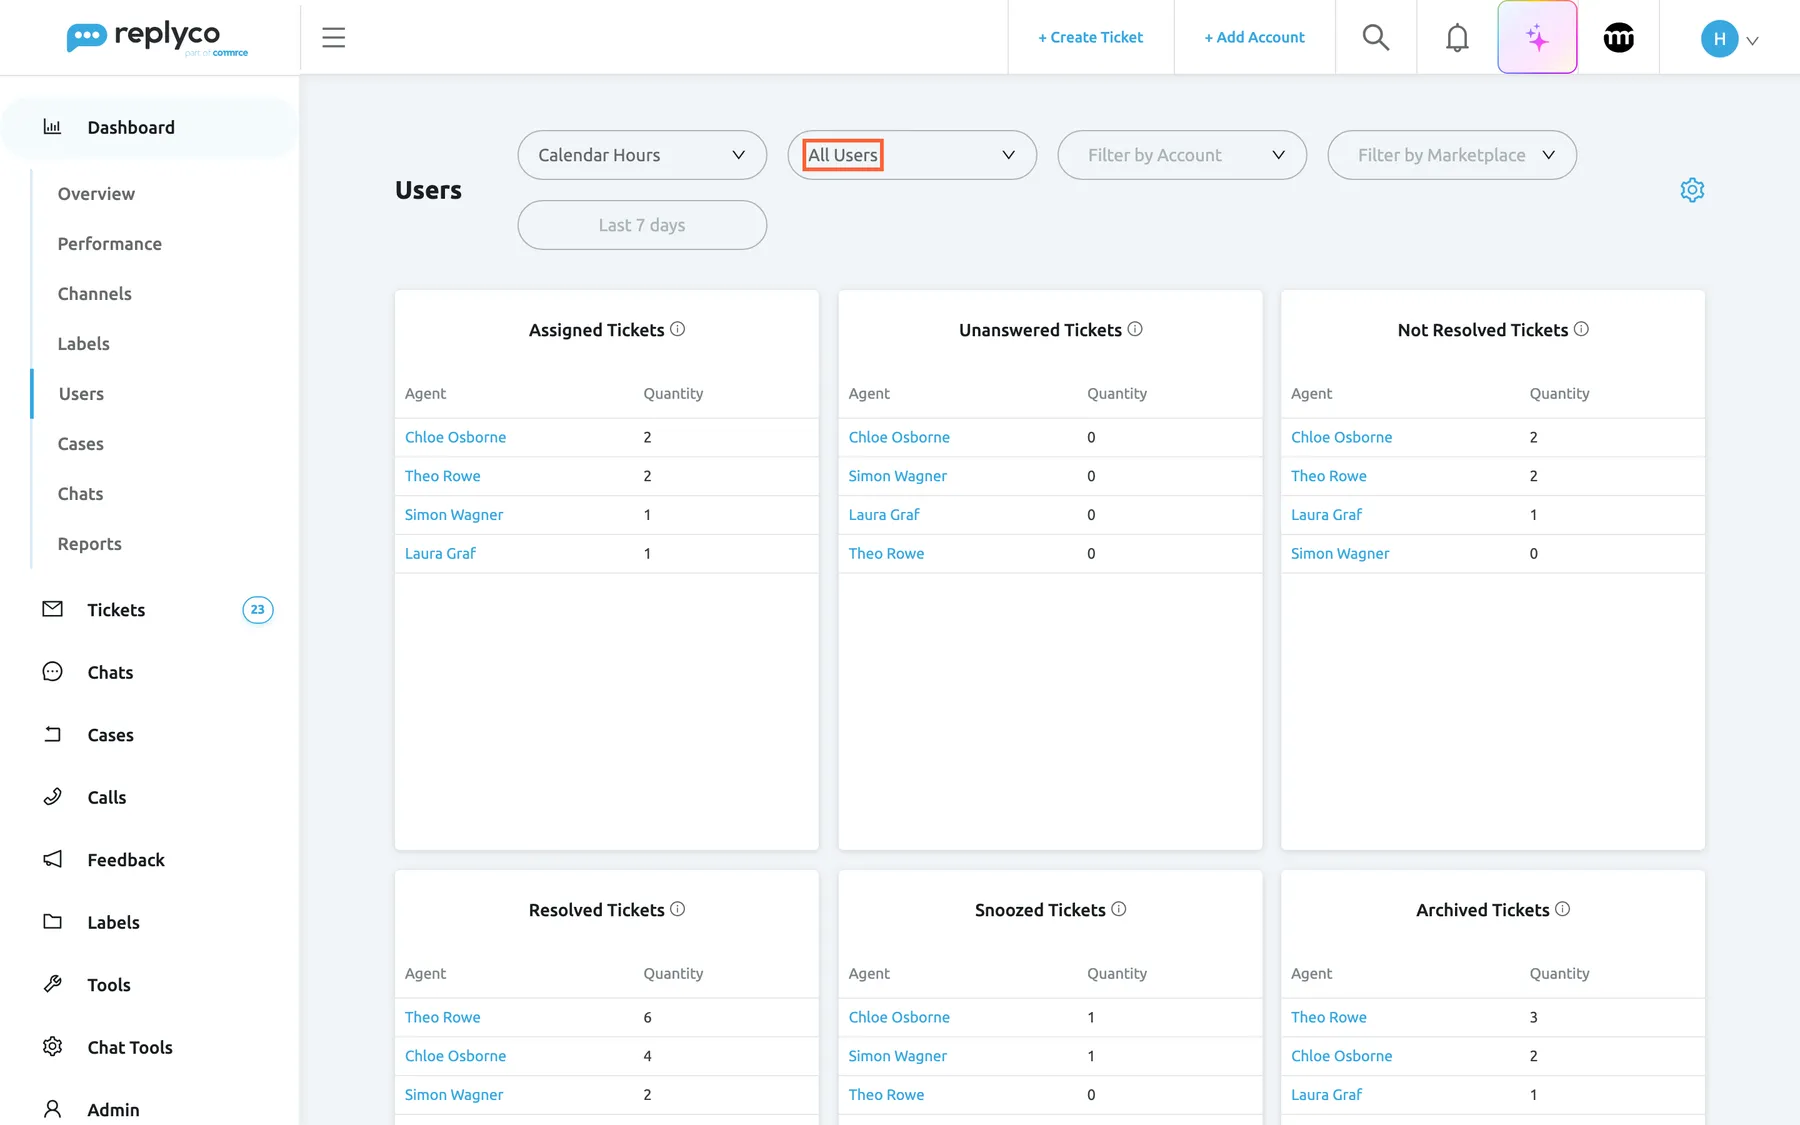
What this screenshot shows
- Screen
- Users (/dashboard/users)
- Highlighted
- combobox “All Users”, header, selected. switches between the All Users view and one user
- Also visible
- hours option Calendar Hours, user filter, account and marketplace filters, period; Assigned Tickets, Unanswered Tickets, Not Resolved Tickets tables with four users; Resolved, Snoozed, Archived Tickets below
- Purpose
- the Users dashboard as it opens
| Region | What it shows | What you do there |
|---|---|---|
| Users, in the sidebar under Dashboard | The fifth dashboard of the menu | Open the dashboard |
| Hours option, first filter | Calendar Hours or Working Hours | Decide how times are counted |
| User filter | All Users or one name | Switch between everyone and one user |
| Filter by Account and Filter by Marketplace | Empty, or the accounts and marketplaces you ticked | Narrow the figures |
| Period button | Last 7 days or your choice | Change the period |
| Gear icon, right | Turn ON Edit Mode and Manage Widgets | Arrange the widgets |
| Widgets | Tables per figure, or cards for one user | Compare, open tickets |
For what every dashboard shares, see How the dashboards count.
Compare all users
Section titled “Compare all users”With All Users in the user filter, each widget is a small table with the columns Agent and Quantity (or Time), sorted from the highest number down, five users to a page.
| Widget | What it counts per user in the period |
|---|---|
| Assigned Tickets | Tickets created in the period that are assigned to the user |
| Unanswered Tickets | Of those, tickets nobody has replied to and nobody has read |
| Not Resolved Tickets | Of those, tickets that are not resolved |
| Resolved Tickets | Tickets the user resolved in the period, whenever they were created |
| Snoozed Tickets | Tickets the user snoozed in the period |
| Archived Tickets | Tickets the user archived in the period |
| Received Messages | Customer messages that arrived in the period on tickets assigned to the user |
| Sent Messages | Messages the user sent from Replyco in the period |
| Responded Messages | Customer messages answered by the user: the user’s reply was the next message |
| Within SLA | Open tickets created in the period, assigned to the user, waiting for a reply within their deadline |
| Overdue SLA | The same, past their deadline |
| Average Resolution Time | How long, on average, tickets the user resolved took from creation to their first resolution |
| Average First Response Time | How long, on average, tickets waited from creation for their first reply, when the user sent it |
| Average Response Time | How long, on average, each customer message waited for the user’s next reply; auto-responses are not counted |
| Message count | A heatmap of messages sent from Replyco, by hour and weekday |
| User Action Count | A line chart of the actions each user took per day |
| User Action Audit Trail | How often each kind of action was taken, such as assigning a user or running a rule |
Two kinds of count. Assigned, unanswered, not resolved and the two SLA tables look at tickets created in the period, credited to the user the ticket is assigned to. Resolved, snoozed and archived count the user’s own actions in the period, taken from the ticket history, so a ticket created last month and resolved today counts today.
Example. For the last 7 days, Resolved Tickets shows Theo Rowe 6, Chloe Osborne 4 and Simon Wagner 2, while Assigned Tickets shows only 2, 2 and 1: most of what Theo resolved this week arrived earlier.
The heatmap’s grid follows the period: up to 7 days it shows hours by weekday, up to about 16 weeks weekdays by week, up to a year weeks by month, and beyond that months by year.
Look at one user
Section titled “Look at one user”-
Select the user filter, which reads All Users.
-
Choose a name. The dashboard switches to cards for that user.
-
Choose All Users again to return to the tables.
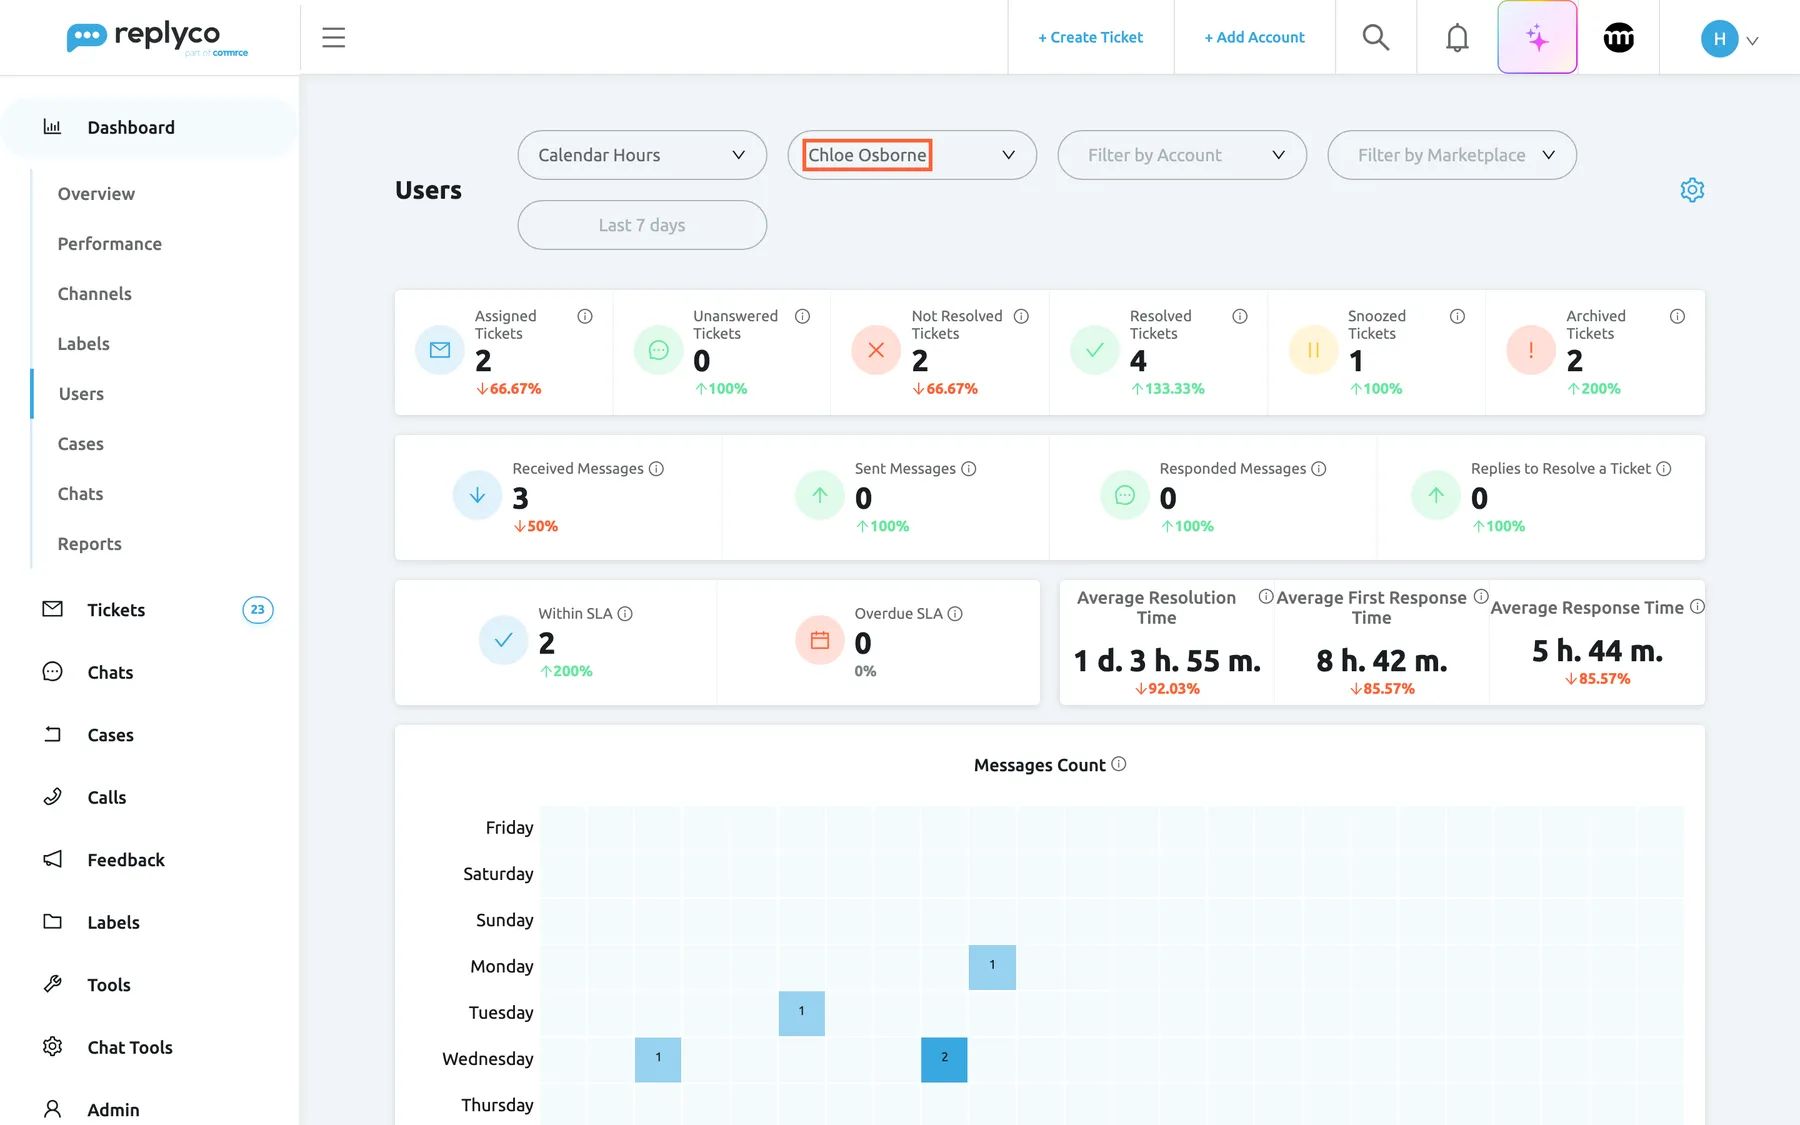
What this screenshot shows
- Screen
- Users (/dashboard/users)
- Highlighted
- combobox “”, header, selected. shows the figures of one user
- Also visible
- ticket cards: Assigned, Unanswered, Not Resolved, Resolved, Snoozed, Archived with percentages; message cards: Received, Sent, Responded, Replies to Resolve a Ticket; Within SLA, Overdue SLA and the three average times
- Purpose
- look at one user
The one-user view shows the same figures as cards: Assigned Tickets, Unanswered Tickets, Not Resolved Tickets, Resolved Tickets, Snoozed Tickets and Archived Tickets; then Received Messages, Sent Messages, Responded Messages and Replies to Resolve a Ticket; then Within SLA, Overdue SLA and the three average times; below them the Messages Count heatmap, User Action Count and User Action Audit Trail for that user.
Replies to Resolve a Ticket divides the user’s messages on tickets resolved in the period by the number of those tickets, rounded down to a whole number.
The percentage under each card compares this period with the one just before it, of the same length. It shows this period’s number as a share of the previous one: 4 resolved tickets after 3 reads 133.33% with a green arrow up, 2 after 3 reads 66.67% with a red arrow down. It reads 100% when the previous period had nothing, and a grey 0% when this period has nothing. When every previous number is 0, the percentages are left out.
Choose calendar or working hours
Section titled “Choose calendar or working hours”-
Select the hours option, the first filter, which reads Calendar Hours.
-
Choose Working Hours. The dashboard reloads.
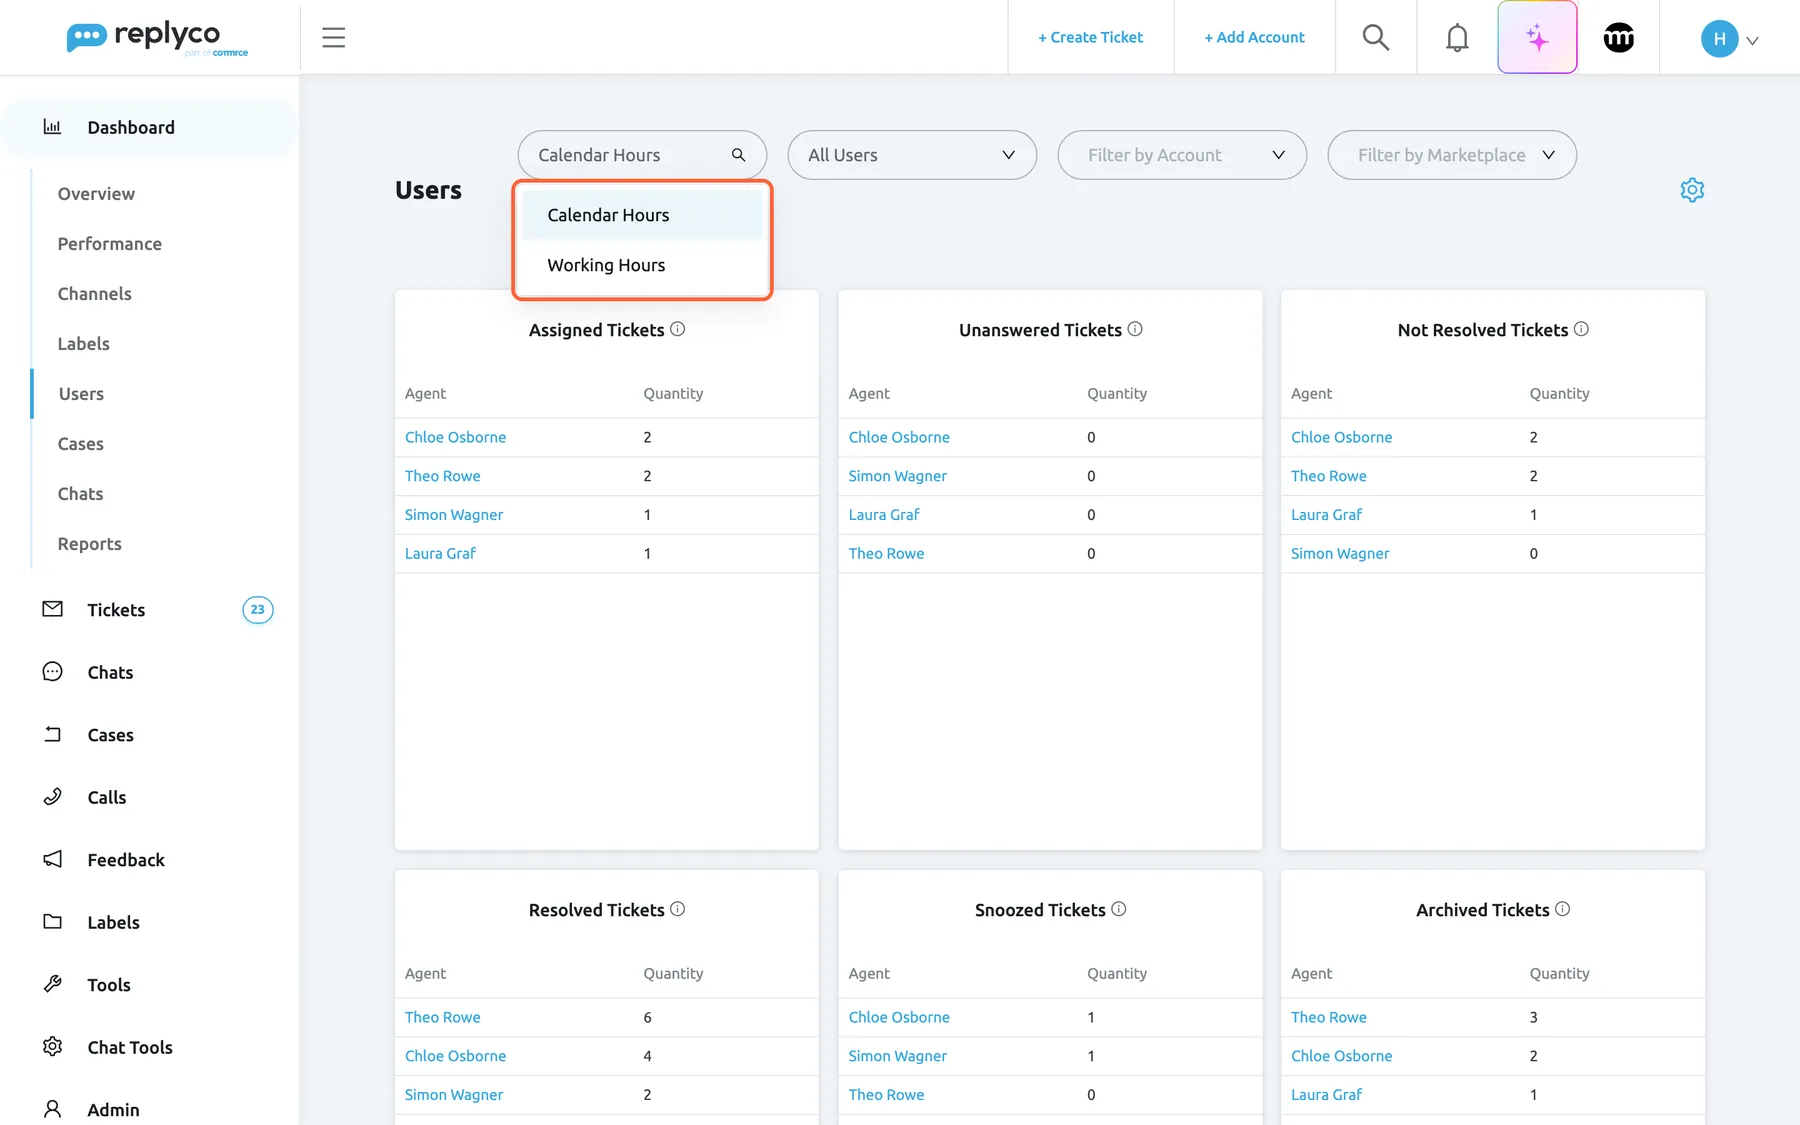
What this screenshot shows
- Screen
- Users (/dashboard/users)
- Highlighted
- listbox “”, header, expanded. counts times in working hours only when Working Hours is chosen
- Also visible
- hours option open: Calendar Hours, Working Hours; All Users widgets below
- Purpose
- choose calendar or working hours
With Working Hours, the three average times count only the time inside your company’s working hours, so a message that arrives on Friday evening and is answered on Monday morning does not add a weekend to the average. Counts of tickets and messages stay the same. Your company’s working hours are set under AdminCompany Settings; see Working time.
The dashboard opens with calendar hours unless Use Working Hours in Dashboards is switched on in your Account Settings; see Account Settings.
Read deadlines and times
Section titled “Read deadlines and times”Further down the All Users view, Within SLA and Overdue SLA list the users whose open tickets are waiting for a reply before or after their respond-by deadline. Only tickets with a priority have a deadline, and the tables look at the deadline as it stands now; see Ticket priorities and SLA.
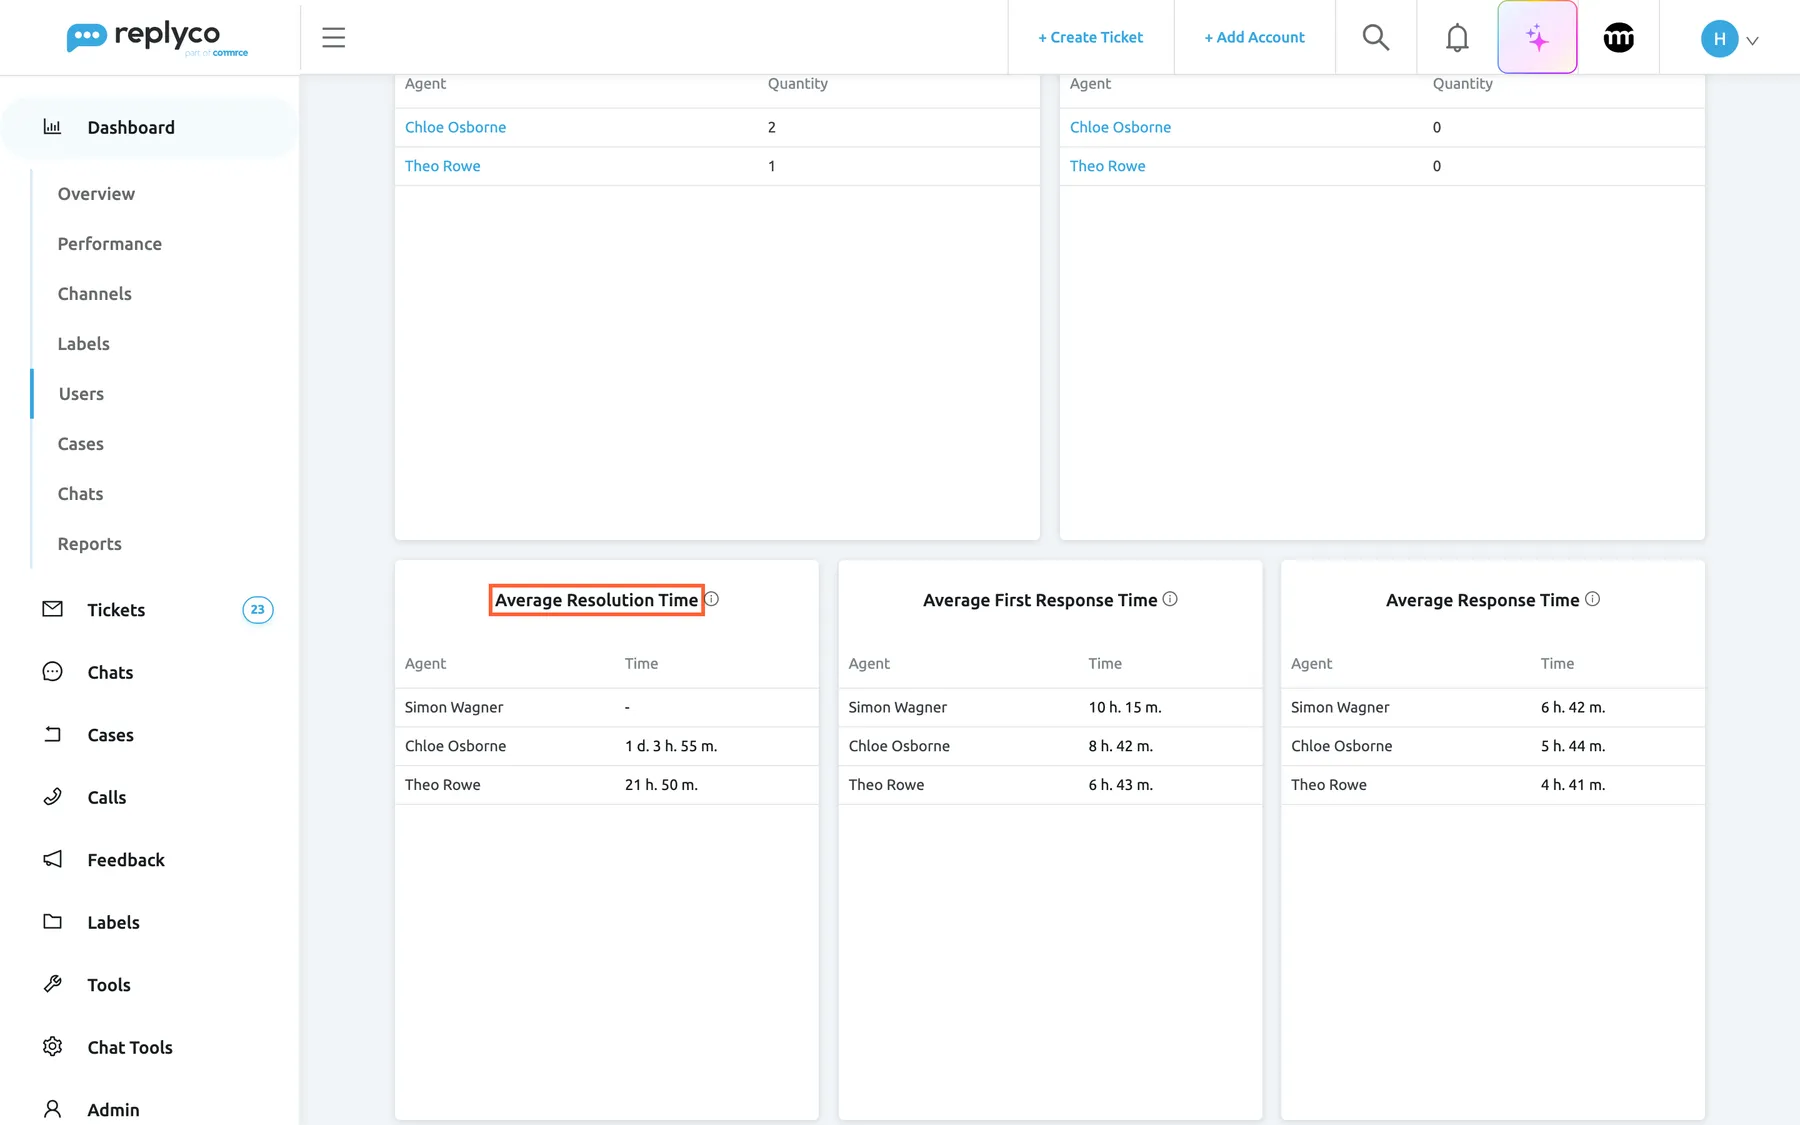
What this screenshot shows
- Screen
- Users (/dashboard/users)
- Highlighted
- heading “Average Resolution Time”, widget-title, enabled. shows the average resolution time per user
- Also visible
- Within SLA and Overdue SLA tables; Average Resolution Time, Average First Response Time, Average Response Time tables
- Purpose
- compare deadlines and times per user
The three time tables show days, hours and minutes, for example “1 d. 3 h. 55 m.”, and ”-” for a user without a value, such as someone who resolved no ticket in the period.
Filter by account, marketplace and period
Section titled “Filter by account, marketplace and period”- Filter by Account and Filter by Marketplace each take one or more entries and narrow every widget.
- The period button offers Today, Yesterday, Last 7 days, Last 30 days, Last 90 days and a custom range. It starts at Last 7 days on every visit: seven days back, today included.
Open a user’s tickets
Section titled “Open a user’s tickets”In the tables for assigned, unanswered, not resolved, resolved, snoozed and archived tickets, and in the two SLA tables, each name is a link. It opens the ticket list for that user and the dashboard’s period and filters, with the matching status: unanswered, not resolved or resolved tickets in All Tickets, snoozed tickets in Snoozed, archived tickets in Archive, and tickets within or past their deadline. The same cards in the one-user view are links too. Names in the message and time tables are not links.
The tooltips warn that archived or snoozed tickets are counted but not shown in the list you open: Resolved tickets by users. Although Archived or Snoozed tickets are included in report totals, they are not shown in the clickable ticket list.
Arrange the widgets
Section titled “Arrange the widgets”Select the gear icon. Turn ON Edit Mode lets you move, resize and remove widgets; Manage Widgets lists every widget of the current view with a tick box. The All Users view and the one-user view have separate layouts, and both are saved for your user only.
One widget of the All Users view is not on the dashboard until you tick it: Replies to Resolve a Ticket.
Every control, explained
Section titled “Every control, explained”Users in the sidebar
Section titled “Users in the sidebar”The sidebar, under Dashboard, between Labels and Cases.
Opens the Users dashboard in the All Users view. Shown only when an admin has ticked Users among your dashboards; locked with Your subscription plan doesn't include this feature. Do you want to go on the billing page to unlock this feature? when your plan lacks Advanced Reporting.
The dashboard shows every colleague’s figures, so admins decide who may see it; see User permissions and roles.
The hours option
Section titled “The hours option”The first filter at the top, reading Calendar Hours or Working Hours.
Decides whether the average times count all hours or only your company’s working hours. Starts with the choice of Use Working Hours in Dashboards in your Account Settings. Counts are not affected.
Response times that include nights and weekends make a team working 9 to 6 look slow.
The user filter
Section titled “The user filter”Beside the hours option.
All Users first, then every user of the company. One choice at a time: All Users shows the tables, a name shows that user’s cards.
Compare the team, or prepare a one-to-one with one person.
Filter by Account, Filter by Marketplace and the period
Section titled “Filter by Account, Filter by Marketplace and the period”The other filters at the top.
Account and marketplace filters take several entries each, starting with Select all; empty means all. The period starts at Last 7 days. None of them is remembered when you leave.
Look at one shop’s team, or at a busy season.
The gear icon
Section titled “The gear icon”Top right.
Turn ON Edit Mode and Manage Widgets for the view you are in; changes are saved at once for your user.
Keep the tables you use and hide the rest.
Widgets of the one-user view
Section titled “Widgets of the one-user view”| Widget in Manage Widgets | What it shows | Why |
|---|---|---|
| General information about tickets | Six ticket cards with percentages | The user’s ticket workload at a glance |
| General information about messages | Four message cards | How much the user wrote and answered |
| Information about resolved time | Within SLA and Overdue SLA | Deadlines at risk |
| Average time | The three average times | Speed compared with the previous period |
| Messages count | The heatmap of the user’s sent messages | When the user works |
| User Action Count | Actions per day | Activity over the period |
| User Action Audit Trail | Actions by kind | What the user spends actions on |
Who sees what
Section titled “Who sees what”| Part of the screen | What decides whether you see it |
|---|---|
| Users in the sidebar | The dashboards ticked for your user on Access Rights in AdminUsers |
| The data, or a lock on the menu item | Advanced Reporting, which every current plan includes; see What each plan includes |
| Every user’s figures | Everyone who can open the dashboard; there is no restriction to one’s own figures |
| Your layouts | Only you |
What you need to know
Section titled “What you need to know”| Topic | Fact |
|---|---|
| Tickets created in the period | Assigned, unanswered, not resolved, within and past deadline |
| Actions in the period | Resolved, snoozed, archived, action count and audit trail |
| Messages in the period | Received, sent, responded, the heatmap |
| Times | Minutes shown as days, hours and minutes; ”-” when there is no value |
| Working hours | Change only the three average times |
| Previous period | The same number of days just before the chosen period |
| Tables | Highest number first, five rows per page |
| Layouts | Two per user: All Users and one user |
Frequently asked questions
Section titled “Frequently asked questions”Figures
Section titled “Figures”Why does a user have more resolved tickets than assigned tickets?
Section titled “Why does a user have more resolved tickets than assigned tickets?”The resolved, snoozed and archived tables count what the user did in the period, whenever the ticket was created. The assigned table counts only tickets created in the period. A user who works through older tickets this week can resolve more than were assigned to them this week.
Why is someone’s average resolution time shown as a dash?
Section titled “Why is someone’s average resolution time shown as a dash?”The average resolution time needs at least one ticket the user resolved in the period. With none, the table shows ”-”. The same applies to the first response and response times when the user sent no reply in the period that could be measured.
Do auto-responses count towards response times?
Section titled “Do auto-responses count towards response times?”No. The average response time measures each customer message against the next reply sent by a user and leaves auto-responses out.
What does the percentage under a card mean?
Section titled “What does the percentage under a card mean?”It is this period’s number as a share of the previous period of the same length: 133.33% means a third more, 66.67% a third less. It reads 100% when the previous period had nothing. The arrow points up from 100% and down below it.
Filters and hours
Section titled “Filters and hours”What changes when I switch to Working Hours?
Section titled “What changes when I switch to Working Hours?”Only the three average times: they count the time inside your company’s working hours, set under AdminCompany Settings, and skip the hours outside them. Ticket and message counts stay the same. To start the dashboard in working hours every time, switch on Use Working Hours in Dashboards in your Account Settings.
Does the dashboard remember the user and filters I picked?
Section titled “Does the dashboard remember the user and filters I picked?”No. Every time you open DashboardUsers, it starts with All Users, every account and marketplace, Last 7 days and the hours option from your Account Settings. Only the widget layouts of both views are saved for your user.
Why is a user missing from one of the tables?
Section titled “Why is a user missing from one of the tables?”Each table on DashboardUsers lists only the users with at least one ticket, message or action counted in it for the period and filters. Choose a longer period or clear the account and marketplace filters, and the user appears once something is counted.
Access
Section titled “Access”Can a user see only their own figures?
Section titled “Can a user see only their own figures?”No. Anyone who can open the Users dashboard sees every colleague’s figures. An admin decides who sees it by ticking Users among the dashboards on the Access Rights tab of the user in AdminUsers. Users invited with the User role start with only the Overview dashboard; the Admin and Moderator roles include every dashboard except Chats. See User permissions and roles.
Troubleshooting
Section titled “Troubleshooting”| Symptom | What to check |
|---|---|
| Users is missing from the Dashboard menu | The dashboards ticked for your user on Access Rights in AdminUsers; users invited with the User role have only Overview |
| A user is missing from a table | The period and the filters; a user appears only with at least one ticket, message or action counted in that table |
| Average times look far too long | The hours option: with Calendar Hours nights and weekends count; switch to Working Hours |
| The list opened from a name shows fewer tickets than the number | Expected for archived and snoozed tickets, which are counted but not shown in the list you open |